Hi experts!
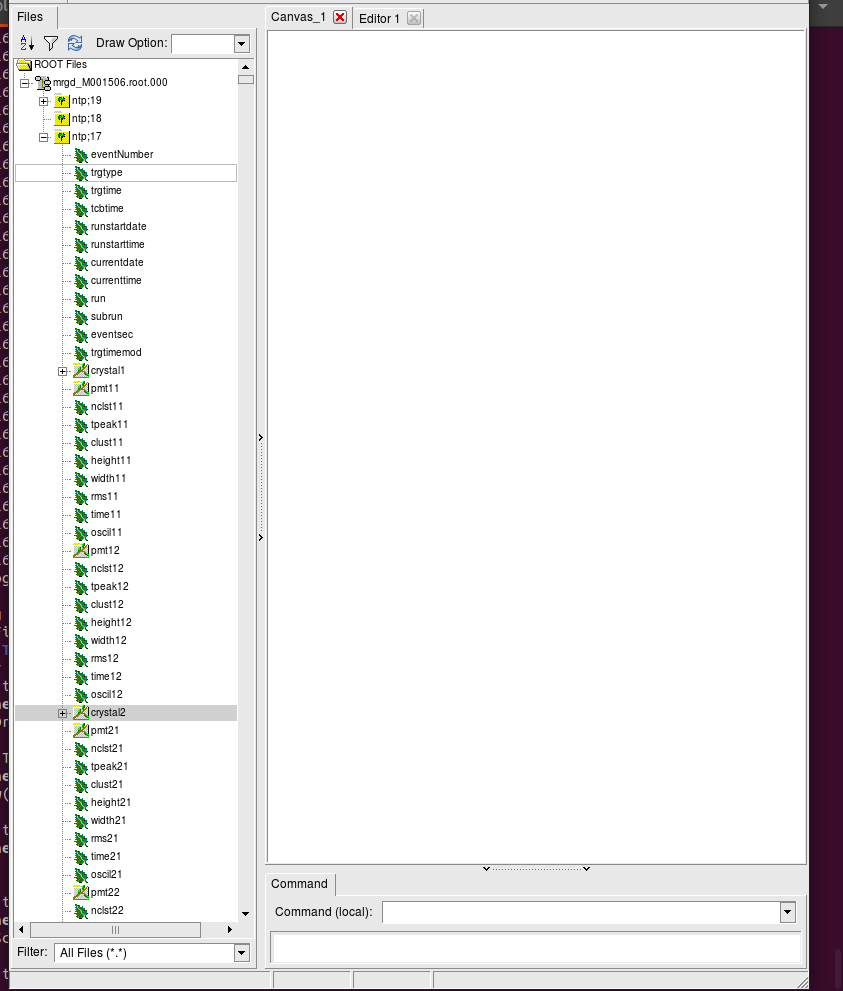
and this is the data structure. Branches are numbered from crystal1 to crystal8.
Please read tips for efficient and successful posting and posting code
ROOT Version: Not ProvidedPlatform: Not ProvidedCompiler: Not Provided
// TFile *f = TFile::Open("mrgd_M001506.root.000");
// TTree *ntp; f->GetObject("ntp", ntp);
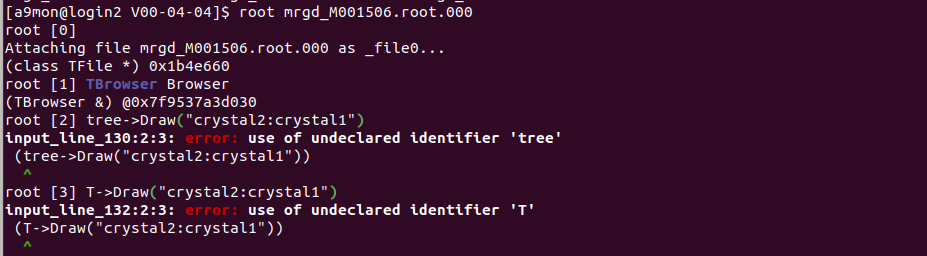
ntp->Draw("some_leaf : other_leaf");
Thanks for reply!
The name of your tree is “ntp”.ntp->Print();
There are so many branches, can I just pick one and show it? For crystal 1
*Br 12 :crystal1 : nc/I:t0/F:t1/F:rqc/F:rqcp/F:rqcn/F:qtail/F:qc/F:qc1/F: *
| qc1_5/F:qc2/F:qc3/F:qc4/F:qc5/F:qc50/F:qc50_100/F:qc100_200/F: *
| qc200_400/F:qc400_1000/F:mt/F:x1/F:x2/F:tzero/F:nmt30/F:nmt300/F:*
| nmt500/F:nmt1000/F:nmt1500/F:nmt2000/F:nq30/F:nq300/F:nq500/F: *
| nq1000/F:nq1500/F:nq2000/F:nx1/F:nx2/F:nx2_80/F:nx2_120/F: *
| cr_50/F:cr_100/F:cr_150/F:energy/F:energyD *
*Entries : 133495 : Total Size= 23504480 bytes File Size = 1432798 *…
Try maybe: ntp->Draw("crystal1.energyD : crystal2.energy");
Thank you for reply !
couet
June 21, 2021, 10:18am
8
That will produce 3 scatter plots. If you what to have these 4 variable in one single plot you can do:
ntp->Draw("crystal1.energyD:crystal2.energy:crystal3.energy:crystal4.energy");
That will produce a 3D scatter for 3 variables and the 4th one will be map on the current colormap.
{
  // TFile *f = TFile::Open("mrgd_M001506.root.000");
  // TTree *ntp; f->GetObject("ntp", ntp);
  TCanvas *c = new TCanvas("c", "c", 900, 300);
  c->Divide(3, 1);
  c->cd(1);
  ntp->Draw("crystal1.energyD : crystal2.energy");
  c->cd(2);
  ntp->Draw("crystal1.energyD : crystal3.energy");
  c->cd(3);
  ntp->Draw("crystal1.energyD : crystal4.energy");
  c->cd(0);
}
Thanks for reply. But i want to overlap it one spectrum. With out dividing the canvas.
couet
June 23, 2021, 9:13am
11
{
  // TFile *f = TFile::Open("mrgd_M001506.root.000");
  // TTree *ntp; f->GetObject("ntp", ntp);
  TCanvas *c = new TCanvas("c", "c", 900, 300);
  c->DrawFrame(x1,y1,x2,y2); // make sure x1,y1,x2,y2 are wide enough
  ntp->Draw("crystal1.energyD : crystal2.energy","","SAME");
  ntp->Draw("crystal1.energyD : crystal3.energy","","SAME");
  ntp->Draw("crystal1.energyD : crystal4.energy","","SAME");
}
{
  // TFile *f = TFile::Open("mrgd_M001506.root.000");
  // TTree *ntp; f->GetObject("ntp", ntp);
  Double_t xmin = ntp->GetMinimum("crystal1.energy");
  xmin = TMath::Min(xmin, ntp->GetMinimum("crystal2.energy"));
  xmin = TMath::Min(xmin, ntp->GetMinimum("crystal3.energy"));
  xmin = TMath::Min(xmin, ntp->GetMinimum("crystal4.energy"));
  Double_t xmax = ntp->GetMaximum("crystal1.energy");
  xmax = TMath::Max(xmax, ntp->GetMaximum("crystal2.energy"));
  xmax = TMath::Max(xmax, ntp->GetMaximum("crystal3.energy"));
  xmax = TMath::Max(xmax, ntp->GetMaximum("crystal4.energy"));
  Double_t ymin = ntp->GetMinimum("crystal1.energyD");
  Double_t ymax = ntp->GetMaximum("crystal1.energyD");
  gStyle->SetCanvasPreferGL(1); // needed for color transparency
  Double_t alpha = 0.25; // e.g. 0.25 or 0.33 or 0.5
  TCanvas *c = new TCanvas("c", "c");
  c->DrawFrame(xmin, ymin, xmax, ymax,
               "all crystals;crystal*.energy;crystal1.energyD");
  ntp->SetMarkerColorAlpha(kBlack, alpha);
  ntp->Draw("crystal1.energyD : crystal1.energy", "", "same");
  ntp->SetMarkerColorAlpha(kRed, alpha);
  ntp->Draw("crystal1.energyD : crystal2.energy", "", "same");
  ntp->SetMarkerColorAlpha(kGreen, alpha);
  ntp->Draw("crystal1.energyD : crystal3.energy", "", "same");
  ntp->SetMarkerColorAlpha(kBlue, alpha);
  ntp->Draw("crystal1.energyD : crystal4.energy", "", "same");
}
I don’t know why you use this code
Double_t xmin = ntp->GetMinimum("crystal1.energy");
  xmin = TMath::Min(xmin, ntp->GetMinimum("crystal2.energy"));
  xmin = TMath::Min(xmin, ntp->GetMinimum("crystal3.energy"));
  xmin = TMath::Min(xmin, ntp->GetMinimum("crystal4.energy"));
  Double_t xmax = ntp->GetMaximum("crystal1.energy");
  xmax = TMath::Max(xmax, ntp->GetMaximum("crystal2.energy"));
  xmax = TMath::Max(xmax, ntp->GetMaximum("crystal3.energy"));
  xmax = TMath::Max(xmax, ntp->GetMaximum("crystal4.energy"));
  Double_t ymin = ntp->GetMinimum("crystal1.energyD");
  Double_t ymax = ntp->GetMaximum("crystal1.energyD");
couet
June 24, 2021, 6:39am
14
To compute the DrawFrame’s parameters.
Is this a necessary process? Can’t we just use the range when drawing on the canvas?
Wile_E_Coyote:
Double_t xmin
I follow the code but it showsTCanvas::Range : illegal world coordinates range: x1=0.000000, y1=-0.125000, x2TCanvas::RangeAxis : illegal axis coordinates range: xmin=0.000000, ymin=0.0000
{
ch->Draw(“crystal1.energyD:crystal2.energy”,"",“same”);
TFile o(“C2_Coincidentevent_1544.root”,“RECREATE”);
couet
June 24, 2021, 9:13am
18
What are the values of xmin, ymin, xmax, ymax just before calling DrawFrame ?
You mean the values of energy? I couldn’t understand your question.
couet
June 24, 2021, 9:29am
20
No, I mean check the values you pass to DrawFrame. They seems not correct.
printf("xmin = %g, ymin = %g, xmax = %g, ymax = %g",xmin, ymin, xmax, ymax);