Hello, I plotted a 2D function as a surf plot (and also as a contour plot, see below). Normally, it should show an elliptical area that falls off quite steeply which it roughly does, however there are some steps in the plot. Can you advise how I can avoid them?
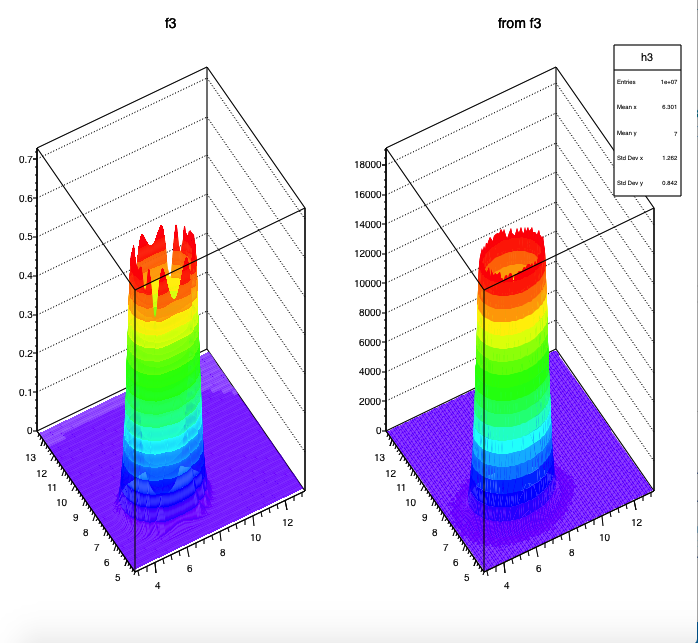
How can I increase the number of bins in a function? I tried with SetNpx( ) and for a similar function to the one above I get oscillations on the rim of the function, see surface plot to the left. I do not see the oscillations if I randomly fill a histogram with the function values, see plot on the right hand-side. Therefore I do believe that the oscillations are an artefact. Can you advise?
Okay, I see. Can you give me a checklist of things worth checking before consulting the forum? Maybe a question catalogue … like
1.) Is the method you used meant to be used with 1D, 2D, 3D histograms, respectively?
2.) …