Dear Experts
I have code to plot 1D 2D and 3D hist distributions by reading hit positions from ROOT file. Screen shot of my TCanvas
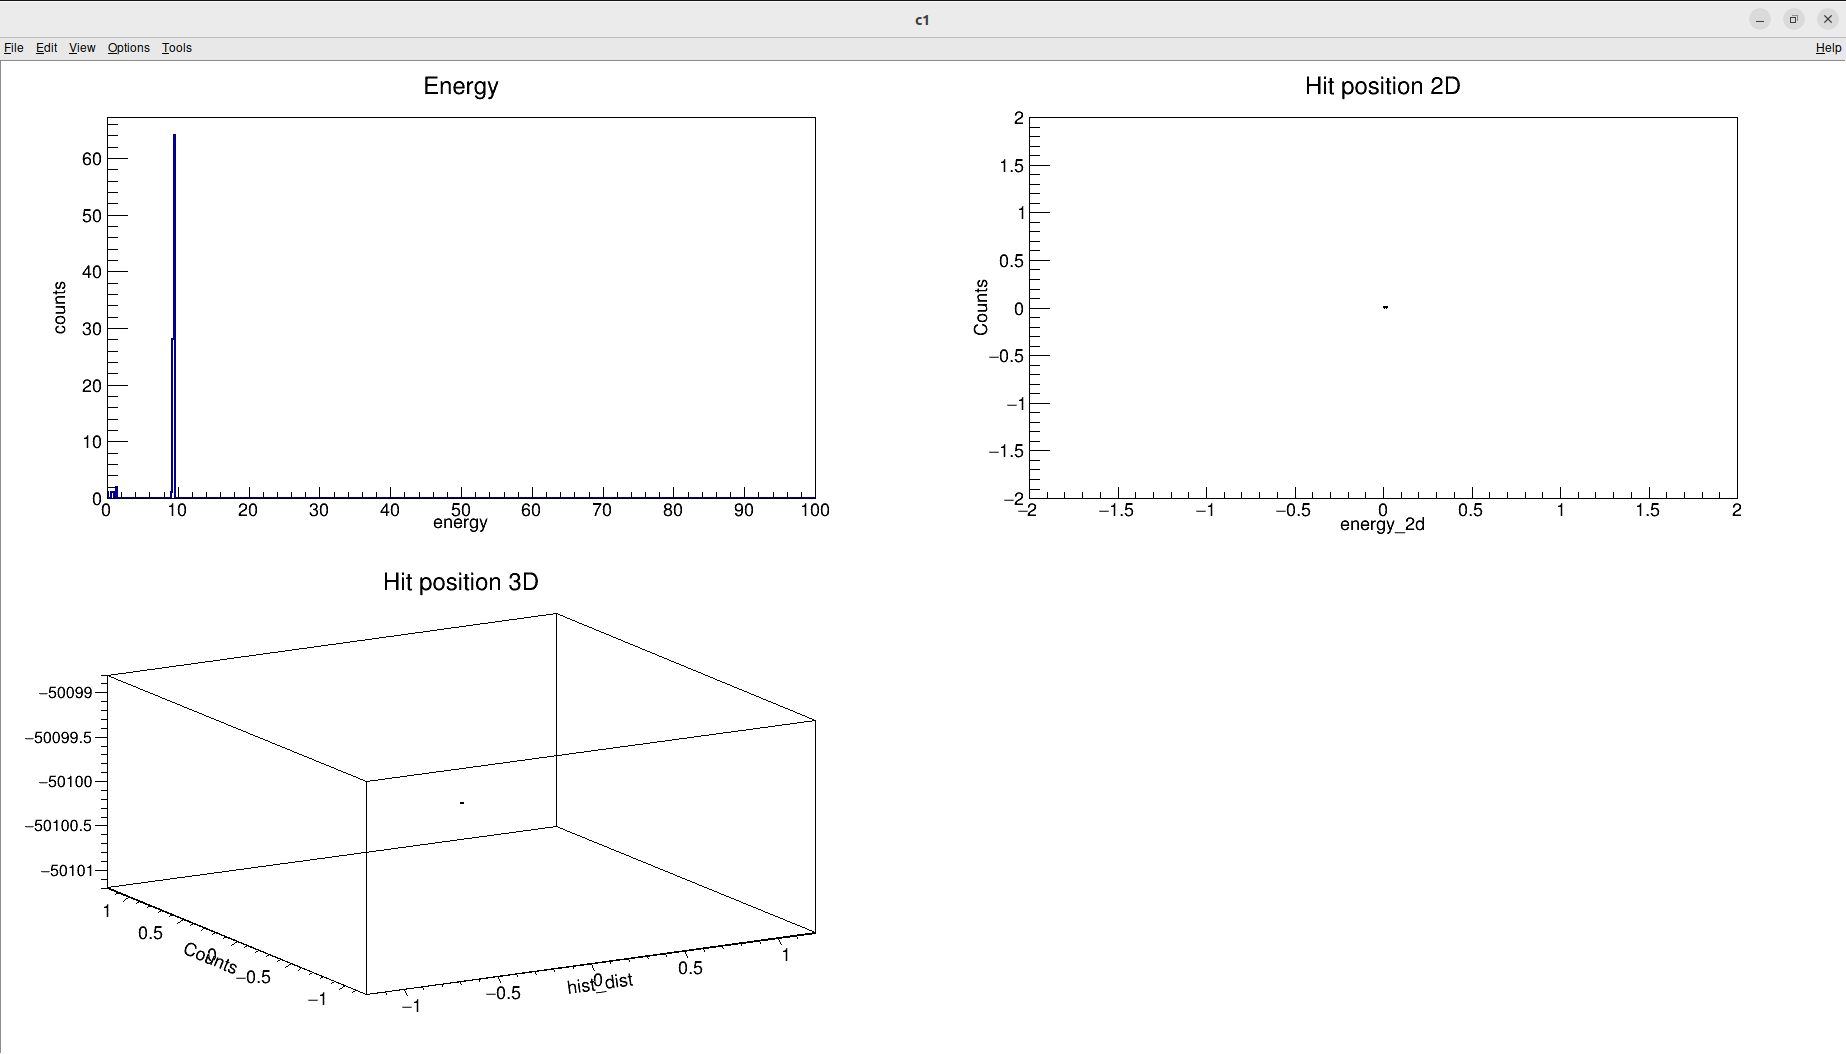
is attached
But What I need is to see scattering plot of hits or hits with legos.
My Code is as follows:
#include "TGraphErrors.h"
#include "TF1.h"
#include "TRandom.h"
#include "TCanvas.h"
#include "TLegend.h"
#include "TMath.h"

void draw_Performance_v01(Int_t nevent = -1)
{

   //==========Style of the plot============
   gStyle->SetPalette(1);
   gStyle->SetOptTitle(1);
   gStyle->SetTitleOffset(.85, "X");
   gStyle->SetTitleOffset(.85, "Y");
   gStyle->SetTitleSize(.04, "X");
   gStyle->SetTitleSize(.04, "Y");
   gStyle->SetLabelSize(.04, "X");
   gStyle->SetLabelSize(.04, "Y");
   gStyle->SetHistLineWidth(2);
   gStyle->SetOptFit(1);
   gStyle->SetOptStat(0);

   //=======Reading the root file DD4HEP===========
   TFile *file = new TFile("mytest_100_10GeV.edm4hep.root"); // Tree with tracks and hits
                                                             // Create the tree reader and its data containers
   TTreeReader myReader("events", file);                     // name of tree and file

   TTreeReaderArray<Float_t> charge(myReader, "MCParticles.charge");
   TTreeReaderArray<Double_t> vx_mc(myReader, "MCParticles.vertex.x");
   TTreeReaderArray<Double_t> vy_mc(myReader, "MCParticles.vertex.y");
   TTreeReaderArray<Double_t> vz_mc(myReader, "MCParticles.vertex.z");
   TTreeReaderArray<Float_t> px_mc(myReader, "MCParticles.momentum.x");
   TTreeReaderArray<Float_t> py_mc(myReader, "MCParticles.momentum.y");
   TTreeReaderArray<Float_t> pz_mc(myReader, "MCParticles.momentum.z");
   TTreeReaderArray<Int_t> status(myReader, "MCParticles.generatorStatus");
   TTreeReaderArray<Int_t> pdg(myReader, "MCParticles.PDG");

   TTreeReaderArray<Float_t> energy(myReader, "LumiDirectPCALHits.energy");
   TTreeReaderArray<Float_t> posX(myReader, "LumiDirectPCALHits.position.x");
   TTreeReaderArray<Float_t> posY(myReader, "LumiDirectPCALHits.position.y");
   TTreeReaderArray<Float_t> posZ(myReader, "LumiDirectPCALHits.position.z");

  // Define Canvas
   TCanvas *c1 = new TCanvas("c1", "c1", 900, 900);
   c1->Divide(2, 2);

   auto hist1 = new TH1F("E[unit]", "Energy", 500, 0, 100);
   auto hist2 = new TH2F("X:Y", "Hit position 2D", 200, -2, 2, 200, -2, 2);
   auto hist3 = new TH3F("Y:Z:X", "Hit position 3D", 200, -50000, -60000,  200, -50000, -60000,  200, -50000, -60000 );
   //auto hist3 = new TH3F("hits", "E;x;y;r", 100, 0., 0., 100, 0., 0., 100, 0., 0.);

   hist1->GetXaxis()->SetTitle("energy");
   hist1->GetYaxis()->SetTitle("counts");
   hist1->GetXaxis()->CenterTitle();
   hist1->GetYaxis()->CenterTitle();

   hist2->GetXaxis()->SetTitle("energy_2d");
   hist2->GetYaxis()->SetTitle("Counts");
   hist2->GetXaxis()->CenterTitle();
   hist2->GetYaxis()->CenterTitle();

   hist3->GetXaxis()->SetTitle("hist_dist");
   hist3->GetYaxis()->SetTitle("Counts");
   hist3->GetXaxis()->CenterTitle();
   hist3->GetYaxis()->CenterTitle();


   //////////////////////////////////////////////////////////////////////
   int count = 0;
   while (myReader.Next())
   {
      if (nevent > 0 && count > nevent)
         continue;
      //  cout<<"=====Event No. "<<count<<"============="<<endl;
      Double_t pmc = 0;
      Double_t etamc = 0;
      Double_t ptmc = 0;

      // MC Particle
      // for (int iParticle = 0; iParticle < charge.GetSize(); ++iParticle)
      for (int iParticle = 0; iParticle < energy.GetSize(); ++iParticle)
      {
         // cout << " PDG: [" << count << ", " << iParticle << "]" << pdg[iParticle] << " Status: " << status[iParticle] << " Pt: " << sqrt(px_mc[iParticle] * px_mc[iParticle] + py_mc[iParticle] * py_mc[iParticle]) << endl;
         if (status[iParticle] == 1)
         {
            /*
             pmc = sqrt(px_mc[iParticle]*px_mc[iParticle]+py_mc[iParticle]*py_mc[iParticle]+pz_mc[iParticle]*pz_mc[iParticle]);
             Double_t ptmc = sqrt(px_mc[iParticle]*px_mc[iParticle]+py_mc[iParticle]*py_mc[iParticle]);
             Double_t etamc = -1.0*TMath::Log(TMath::Tan((TMath::ACos(pz_mc[iParticle]/pmc))/2));
            */

            hist1->Fill(energy[iParticle]);
            hist2->Fill(posX[iParticle], posY[iParticle]);
            hist3->Fill(posX[iParticle], posY[iParticle], posZ[iParticle]);

         }
      }

      count++;
   }

  c1->cd(1);
   hist1->Draw();
   c1->cd(2);
   hist2->Draw();
   c1->cd(3);
   hist3->Draw("COL");
   c1->SaveAs("eicrecon_distr.png");
   c1->SaveAs("eicrecon_distr.pdf");


}