I have problems with negative values in 2D histograms as well with TGraph2D. I am using ROOT5 on a Redhat 8 Linux-intel box.
I would like to see negative values under the z=0 plane but couldn’t manage to do that.
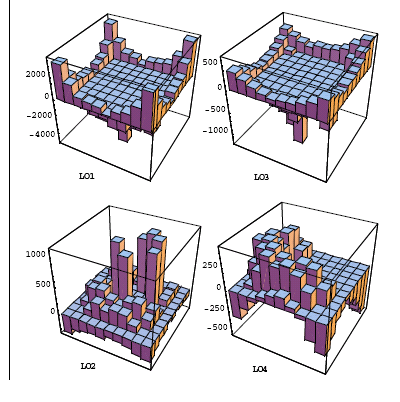
For example, in 2D histograms, positive values should be drawn upwards and negative values downwards. This is the way Mathematica does it for instance.
Does anybody know how to do this in ROOT and even if it is possible?
I wouldn’t find any answer in the manual.
You did not tell what kind of representation you are using. Is it LEGO SURF BOX COL … ?
We have recently introduced the option BOX1 making the difference between + and - values. Can you give an example showing what you are doing ?
[quote=“couet”]You did not tell what kind of representation you are using. Is it LEGO SURF BOX COL … ?
We have recently introduced the option BOX1 making the difference between + and - values. Can you give an example showing what you are doing ?[/quote]
Sorry about the lack of picture last time. I have attached one that shows you what I would like to do (similar to Lego plot) with positive and negative values.
Too bad! Having an histogram view is somehow "niceré to look than with the surface plot. Do you know if there is a plan to have the view I would like? It seems to be commonly used in matlab, mathematica and excel.
We have plans to use openGL to render legos and surfaces. That kind of option can be included. I do not know how difficult/easy it is to do it with the current implementation of LEGOs. I should have a close look to evaluate.