I written a program that gathers data for me and as an output I have made a histogram with ROOT. I can save the histogram and open it, and everything is perfect – all the data I want is there and I can see it when I open a new terminal and open root using .root -l and then open the file > open the histogram > and finally draw the histogram. But when I write histo->Draw() in my actual program that I have written that saves the histogram, the histogram is not drawn. Any ideas why or how to fix this?
Hard to tell without seeing one single line of code, but you should at least make sure the histogram is not attached to the file you are closing (and hence also deleted). See for example [url=https://root-forum.cern.ch/t/problems-when-drawing-a-th1f-recoverd-from-a-root-file/12312/4 post[/url] (See also the User’s Guide chapter on Object Ownership). And if it doesn’t help, post a running short macro illustrating what you are doing and reproducing the problem.
Hmm, neither of those commands worked, and after reading the Object Ownership section of the User’s Guide I still can’t think of any reason why it isn’t working…
Here is the function/code that I am using, in it’s entirely. It’s fairly short and straightforward.
[code]void RootIO::Histogram()
{
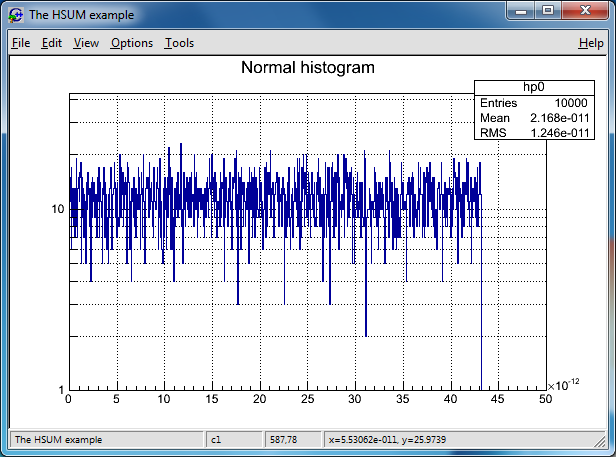
TCanvas *c1 = new TCanvas(“c1”,“The HSUM example”,200,10,600,400); //create a canvas for the histogram
c1->SetGrid();
c1->SetLogy();
histo = new TH1F(“hp0”,“Normal histogram”,1000,0,0.00000000005); //create new histogram
histo->SetBit(TH1::kCanRebin);
int num;
double charge;
ifstream inData;
inData.open("output.txt");
G4cout << "Input file opened." << G4endl;

const int gain = 1000000; //10^6

inData >> num; //Get the first value
while(inData)
{
	//Put data into histogram
	charge = num*0.27*gain*1.6*0.0000000000000000001;
	G4cout << "# of photons that hit: " << num << " Charge value stored: " << charge << G4endl;
	histo->Fill(charge);
	inData >> num; //get another value
}

inData.close();
G4cout << "Input file closed." << G4endl
<< "Drawing histogram..." << G4endl;
histo->Draw();
histo->Print();

TFile f("histo.root","recreate"); //Open file, then write histo to it.
histo->Write();
Huh, even with histo->Paint();
c1->Modified();
c1->Update(); after Draw() and Print() it didn’t work.
Must just be my machine. I’ll just do it the old fashioned way and open it manually instead of having it automated I guess.
If anyone one else has any ideas though I’m still open. I’m surprised this doesn’t work…
histo->Draw(); ///// <<<<< Not Paint !
c1->Modified();
c1->Update();
Can you provide a macro we can run ? Bertrand made a random histogram because you did not provide the histogram you are drawing. May be it has some problem. So a self contained small example reproducing your problem would help.
Which ROOT version are you using ? on which machine ?
I had the same problem with a graph. I solved using TApplication. That worked but introduced a new issue for me because I don’t know how I can return to the main after calling TApplication::Run().
Check this post [url]Libraries Compilation Error out especially the final part, all I am saying is explained
@couet: I was writing both histo->Draw() and histo->Paint() to see if either worked, neither did. I have the Paint() command commented out now, so it’s not running. I know it’s not a problem with the data, but I’ll post up my input file anyways – it’s titled “output.txt”. I’m running ROOT 5.28 on Ubuntu 11.04.
I just tried sirio’s fix, and it worked! I can see the histogram now. The only thing is, when the histogram comes up, the program doesn’t end, it just sits there until I go to histogram, go to File > Quit ROOT.
Now, is there any way to produce the histogram, end the program, and keep the histogram up?? That would be really nice. Maybe make the histogram a picture instead or something? No idea if ROOT can do this…
Here is the code I used from couet:
At the very beginning:
TApplication* theApp = new TApplication("App", 0, 0); At the very end: theApp->Run();
gSystem->ProcessEvents(); And that’s it.
[quote]Now, is there any way to produce the histogram, end the program, and keep the histogram up?? [/quote]Not really … short of creating an image file and starting another program to show it … To create the picture simply use canvas->SaveAs(…)