Histogram with [x,y) bin and store in tree

ROOT Version: 6.18/00
Platform: Ubuntu 20.04.2 LTS
Compiler: C++/ROOT


Hello everyone , I’m new to root.
I would like to make a histogram from data file (below is the images) and store in a tree in a ROOT file.

Also, I wanted to plot a topographical contour as N(3rd column) = f(pz,pt) bins with pz along the horizontal and pt the vertical.
Can anyone please help me ?

You can use TTree::ReadFile

Thanks for the reply.

I have the idea with a bin centre value like
pz pt
0.3 0.10
0.5 0.20
0.32 0.12


.
I’m not quite sure about the histogram with bin range.

Can I please get more clarification?

If you create a TNuple or a TTree using ReadFile as I mentioned before. You will then have a tree with 3 columns pz pt and POT. If you want to see pz vs pt you then do:

root [0] yourtree->Draw("pz:pt");

Yes, I have the idea for that.
Here is my code:

void dat_root()
  { 
   ifstream data;
   Float_t xF, pT, xsect, error;
   
   data.open("data.txt");
   TFile* file = new TFile("data.root","RECREATE");
 
  // TTree* tree = 0;  
   TNtuple* ntup = new TNtuple("ntup","import data file","xF:pT:xsect:error");
   
   while(1){ 
   data>>xF>>pT>>xsect>>error;
   if(!data.good()) break;
   
   ntup->Fill(xF,pT,xsect,error);
  // cout<<xF<<pT<<xsect<<error<<endl;
   }  
   data.close();
   file->Write();

And here is the text file ;

#xF   pT  xsect  error
0.010 0.050 576.05603 9.82745
0.010 0.100 539.52253 8.51654
0.010 0.150 445.00001 6.66747
0.010 0.200 361.98333 5.64581
0.010 0.250 274.02531 4.79218
0.010 0.300 218.10507 4.38402
0.010 0.400 113.03824 2.17800
0.010 0.500 60.95881 1.57144
0.010 0.600 35.18787 1.18463
0.010 0.700 18.92297 0.85714
0.020 0.050 468.95175 10.15406
0.020 0.100 464.94718 7.17576
0.020 0.150 407.03352 6.65860
0.020 0.200 320.49617 5.40648
0.020 0.250 256.70166 4.78191
0.020 0.300 189.21733 3.91935
0.020 0.400 107.04824 1.97835
0.020 0.500 59.08772 1.57044
0.020 0.600 33.43162 1.18071
0.020 0.700 18.74202 0.87785
0.025 0.800 10.58136 0.41885
0.025 0.900 6.44480 0.33107
0.025 1.000 3.27737 0.21996
0.025 1.200 1.37635 0.10211
0.030 0.050 387.01476 8.26072
0.030 0.100 387.89989 6.96068

But, I’m confused with that range [0.30,0.50),…
How can I do the same ?

Sorry for my ignorance.
Thanks

try:

   TTree *T = new TTree("T","data from ascii file");
   Long64_t nlines = T->ReadFile("data.txt","xF:pT:xsect:error");
   T->Draw("xF");

void simple_tree()
{
   TFile *f = new TFile("data.root","RECREATE");
   
    Int_t nEntries = 270;
    Int_t nbins = 270;   
   
   TH2F* hist = new TH2F(""," ",nbins,0,0.5,nbins,0,1);
   TCanvas* c = new TCanvas("c","",800,600);
   
   TTree *tree = new TTree("data","data from ascii file");
   Long64_t nlines = tree->ReadFile("data.txt","xF:pT:xsect:error");
   printf(" found %lld pointsn",nlines);
   tree->Write();
   
   tree->Draw("pT:xF>>hist","xsect","colz");
  
   c->Update();
}

Thank you.
Actually, I have this. But how will I write those range in text format?
For example ;

pz                                                pz
[0.30,0.50)        as  like this-->    0.30
[0.30,0.50)                                   0.30
...                                                 ...
..                                                 ...    
[0.50,0.62)                                 0.50
..

what do you mean by “range” ?

{
  double pz_bins[] = {0.30, 0.50, 0.62, 0.75, 0.88, 1.00};
  unsigned long n_pz_bins = sizeof(pz_bins) / sizeof(double) - 1;
  double pT_bins[] = {0.00, 0.10, 0.20, 0.30, 0.40, 0.50};
  unsigned long n_pT_bins = sizeof(pT_bins) / sizeof(double) - 1;
  TH2D *h = new TH2D("h",
                     "N(#pi^{+}_{}) / POT;p_{z}^{} (GeV/c);p_{T}^{} (GeV/c)",
                     n_pz_bins, pz_bins, n_pT_bins, pT_bins);
  h->SetStats(kFALSE);
  double N[] = {3.32e-01, 3.25e-01, 1.93e-01, 1.06e-01, 0.0, // missing data!
                9.20e-02, 1.37e-01, 9.03e-02, 4.92e-02, 1.42e-02,
                6.02e-02, 1.11e-01, 8.26e-02, 4.32e-02, 2.19e-02,
                4.27e-02, 9.19e-02, 7.46e-02, 4.21e-02, 2.16e-02,
                3.42e-02, 7.50e-02, 6.68e-02, 3.82e-02, 1.99e-02};
  unsigned long n_N = sizeof(N) / sizeof(double);
  if (n_N != (n_pz_bins * n_pT_bins)) {
    std::cout << "Error: missing data." << std::endl;
    return;
  }
  for (int i = 1; i <= n_pz_bins; i++)
    for (int j = 1; j <= n_pT_bins; j++)
      h->SetBinContent(i, j, N[((i - 1) * n_pT_bins + (j - 1))]);
  h->Draw("COLZ TEXT");
}

Thank you very much .

I do really appreciate it for the help.

Hi,

I have 1d histogram and I have saved it with “.root” extension. If I zoom it on the x axis to study a particular region, it does not look good unless I increase the bin size. But doing the analysis of ~1hr everytime just to change the x axis range and bin size does not make much sense. How can I change the bin size from the root file?

ps: I know I can change it from the .C file, but I was just curious if I can do it from the root file also as it is much easier.

Thanks for any suggestions :slight_smile:

It is not a matter of “.root file” or “.C file”. We are talking about a 1D histogram here. You create it in a macro (the .C file) and save it for later use in a “.root” file. Once saved in a .root file (a TFile) you cannot change the booking parameters (limits, bin size etc…) like you would do at creation time in the ROOT macro. When you zoom a histogram on the X axis, you will reach a zoom level where there is only a few bins displayed and, at the extreme, only one. I do not understand how “increasing the bin size” would help. It is the opposite I would say. Can you provide some concret example ?

Hello, I would like to kindly ask a question in extension to this.
I would like to access the bin center for each x (pz_bins) and y (pT_bins).

Also, plot the value(here : stats_error) with a different marker style for different value range. I have searched in the past questions but couldn’t find what I exactly want.

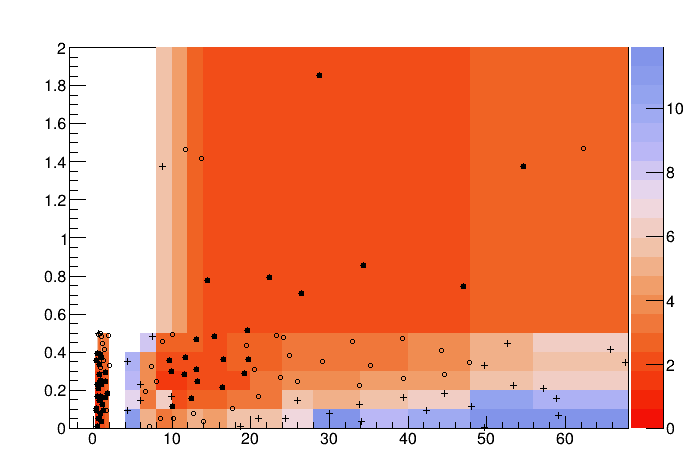
I have attached the plot which I attempts along with the code (ask.C (3.2 KB) ) .

As seen from the plot, it stores the value in all the bins. I would like to store only in the bin center of (pz,pT).
If you could help me I would be very grateful.

Sorry for my ignorance.
Thanks again in advance.

https://root-forum.cern.ch/search?q=TH2D%20getbincenter

What do you mean?

Thanks for the reply.

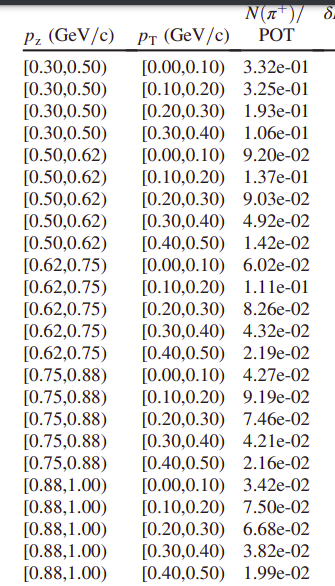
Statistical error/uncertainty ( stats_error[] in my code ask.C (3.2 KB) ) on measurement of the number of pions in (pz,pT) phase space varies from 0 to 10 (or more) percentage.
I wanted to plot them using different marker style i.e, < 2.5 % (as dot) , between 2.5% and 5% (as circle) and >5% (as plus) in (pz,pT) bins.

I’m sorry if my explanation is not clear.(Please kindly correct me if I’m wrong)

Not sure I understand correctly, but I guess:

  • you want to plot “he” as colour (“colz”)
  • for “he_a/b/c”, you only want the marker at the corresponding bin; then we just need any value in the bin (the value is not important), to plot the marker. Maybe something like this:
for i in x bins {
  for j in y bins {
    he -> setbincontent(i,j,error);  // so the values are shown as colour
    if (error < 2.5%) he_a -> setbincontent(i,j,1);
    else if (error < 5%) he_b -> setbincontent(i,j,1);
    else he_c -> setbincontent(i,j,1);
  }
}
// set the marker styles you want for a, b, c:
he_a->SetMarkerStyle(...);
he_b->SetMarkerStyle(...);
he_c...
// draw
he->Draw("colz");
he_a->Draw("same");
he_b->Draw("same");
he_c->Draw("same");

Yes, This is what I want.

But, for this case "i " will be 0.30 , 0.5, 0.62, …and so on while “j” will be 0.00, 0.10, 0.20 …(if I’m not wrong).
I would want my “i” to be the center of 0.30 and 0.50, 0.50 and 0.62 , 0.62 and … and “j” to be center of "0.00 and 0.10, 0.10 and 0.20, and so on.

Is it possible?

May be:

x = h.GetXaxis()->GetBinCenter(i);
y = h.GetYaxis()->GetBinCenter(j);

?

I think this works when a histogram is stored in a root file.
you mean like this?

for ( int k = 1; k<=n_pz_bins; k++)
for ( int l = 1; l <= n_pT_bins; l++)
he->SetBinContent(k, l, stats_error[((k - 1) * n_pT_bins + (l - 1))]);
double x = ((TAxis*)he->GetXaxis())->GetBinCenter(k);
double y = ((TAxis*)he->GetYaxis())->GetBinCenter(l);

I see, the markers are not drawn at the bin centres. I don’t know if there’s an option to fix that, but one workaround coule be the “text” option, which is centred; since this shows the value of the bin, and you need 3 markers, you could use values of 1, 0 and -1 in the SetBinContent lines, instead of 1 (for a, b, and c, resp.), then draw with he_a->Draw("same,text"); and so on.
(or use GetBinCenter on “he” and define new histos for a/b/c with these new bins)