Is it possible to centre the text over bar in histogram “text0 bar” over the centre of the bar? This option is necessary if one wants to draw two bar histograms on the same plot (“same”) with “text0 option” - otherwise text only from a single histogram overlaps…
If not, maybe there is some way of manually setting the test position?
The only other way that I can think of would be recreating both histograms with two times the original number of bins, filling the first one normally, second one with each “bar” shifted by one bin to the right and drawing them on the same plot. But it seems to be the “hard way”.
I am not sure to understand what you mean … so let me explain what TEXT0 does and you will see if that’s what you want.
On 1D histogram the option TEXT0 draws the bin content, above the top of each bar, horizontally. The size of the text is proportional to the histogram marker size. The X position is centered on the middle of the bin and cannot be changed. The Y position is also calculated automatically and cannot be changed either.
OK, the key words were “x position cannot be changed”. Unfortunately it makes “text” option useless with 2 histograms drawn with “bar” on the same plot…
Hmmm … actually thinking of it … I do not think that will help.
I guess the simplest with the current implementation would be to plot the text separately with fakes histograms which will shift the text (with option SAME)
OK, works very nice. I paste below the fragment of pyROOT code, assuming histograms hk and hm are already prepared. Maybe someone will make use of it one day…:
hk.Draw("hist bar1")
hm.Draw("hist bar1 same")

if hk.GetMaximum()<hm.GetMaximum(): hk.SetMaximum(hm.GetMaximum()+2)
gPad.Modified()

# Draw text0 option over bars, but centering over bars, not bin
dt = 0.02*(gPad.GetY2()-gPad.GetY1())

text = TLatex()
text.SetTextAlign(21)
text.SetTextFont(gStyle.GetTextFont());
text.SetTextColor(hk.GetMarkerColor());
text.SetTextSize(0.03*hk.GetMarkerSize());

for i in xrange(1, hk.GetNbinsX()+1):
	x  = hk.GetXaxis().GetBinCenter(i)
	y  = hk.GetBinContent(i)
	text.DrawLatex(x-hk.GetBarWidth()/2., y+0.2*dt+0.3, '%.2f%%' % y)

for i in xrange(1, hm.GetNbinsX()+1):
	x  = hm.GetXaxis().GetBinCenter(i)
	y  = hm.GetBinContent(i)
	text.DrawLatex(x+hm.GetBarWidth()/2., y+0.2*dt+0.3, '%.2f%%' % y)

gPad.Modified()
gPad.Update()
Could you, please, post a screenshot so that I understand what it’s all about?
If possible, two pictures side by side - the “standard” one and the “modified” one.
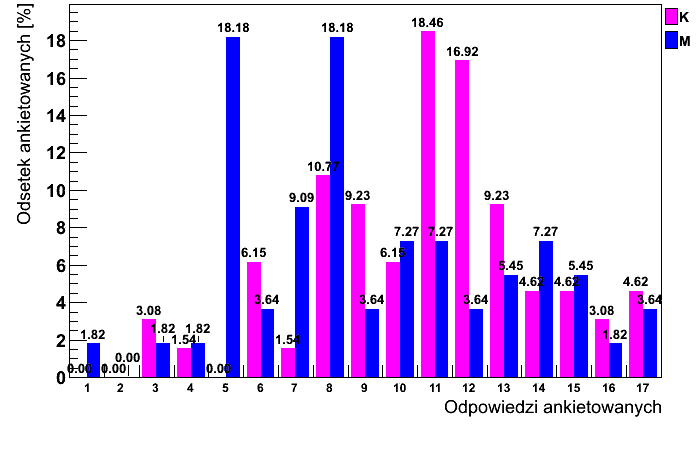
I attach a histogram generated by myself, half manually. With standard drawing, you would have labels over bins pleced in the same horizontal position - centre of the bin - and overlaping for both histogram.
May be that’s something we could consider to have when the histo is plotted with option TEXTBAR
In that cas the text should be aligned on the position given by the bar width and bar offset
Would it be difficult for you to add a possibility to set/get the label over bar vertical position?
I’ll explain: Sometimes the labels for thin bars (many bins) overlap when they are on similar height. It is not very well visible in the sample picture I posted (but it can be spotted in 3rd and 4th bin), but in this case I check the Y position of two neighbouring labels, move up above both neighbouring labels or just one of them (depending on relative heights) and draw a line from the label to the bar. This requires ability to set the label height, of course. It would be great if ROOT could do such vertical label moving automatically, but I guess it’s a little bit more coding.
However, I attach my dirty pyROOT code part that does the moving for me, only in 2 histogram (2 bars per bin) case (it assumes hm and hk histogram are defined):
	lin = []

	for i in xrange(1, hm.GetNbinsX()+1):
		x  = hm.GetXaxis().GetBinCenter(i)
		xn=x
		if(i<hm.GetNbinsX()):
			xn = hm.GetXaxis().GetBinCenter(i+1)
		y  = hm.GetBinContent(i)
		shifter=0
#		if y!=0 and
		if ((posy[x]<y+15*my and posy[x]>y-15*my) or (posy[xn]<y+15*my and posy[xn]>y-15*my)) and hm.GetBarWidth()/mx<30:
			if ((posy[x]<y+15*my and posy[x]>y-15*my) and (posy[xn]<y+15*my and posy[xn]>y-15*my)) or (posy[x]>posy[xn]-30*my and posy[x]<posy[xn]+30*my): shifter=max(posy[x], posy[xn])+12*my-y
			elif posy[xn]<y+15*my and posy[xn]>y-15*my: shifter=posy[xn]+12*my-y
			elif posy[x]<y+15*my and posy[x]>y-15*my: shifter=posy[x]+12*my-y
			print i, y, posy[x], posy[xn]
			lin.append(TLine(x+sbin+hm.GetBarWidth()/2.-1,y+my*2, x+sbin+hm.GetBarWidth()/2.-1, y+shifter+my*1))
			lin[-1].Draw()
			print x
#		if(y!=0):
		text.DrawLatex(x+hm.GetBarWidth()/2., y+my*5+shifter, '%.2f' % y)