Hello dear ROOTers,
facing a problem with histogram cosmetics.
Try to set fill style of a histo and see no changes, line style is without change as well and cannot see the line at all, only dots with error bars. Can change color and width.
A part of a code is here:
         h_Sig_Amp_TP_ref[ch+8*b] = (TH1F*)f_ref->Get(Form("Sig_Amp_TP_b%i_ch%i",b,ch));
         double scaleTPRef=1.0/h_Sig_Amp_TP_ref[ch+8*b]->Integral() ;
         h_Sig_Amp_TP_ref[ch+8*b]->SetLineColor(kRed);
         h_Sig_Amp_TP_ref[ch+8*b]->SetLineWidth(2);
         h_Sig_Amp_TP_ref[ch+8*b]->SetLineStyle(1);
         h_Sig_Amp_TP_ref[ch+8*b]->SetFillStyle(3004);
         h_Sig_Amp_TP_ref[ch+8*b]->SetFillColor(kRed);
         h_Sig_Amp_TP_ref[ch+8*b]->Scale(scaleTPRef);
         h_Sig_Amp_TP_ref[ch+8*b]->SetStats(0);

         double scaleTP=1.0/h_Sig_Amp_TP[ch+8*b]->Integral() ;
         h_Sig_Amp_TP[ch+8*b]->SetLineWidth(2);
         h_Sig_Amp_TP[ch+8*b]->SetLineStyle(1);
         h_Sig_Amp_TP[ch+8*b]->SetFillStyle(3005);
         h_Sig_Amp_TP[ch+8*b]->SetFillColor(kBlue);
         h_Sig_Amp_TP[ch+8*b]->Scale(scaleTP);
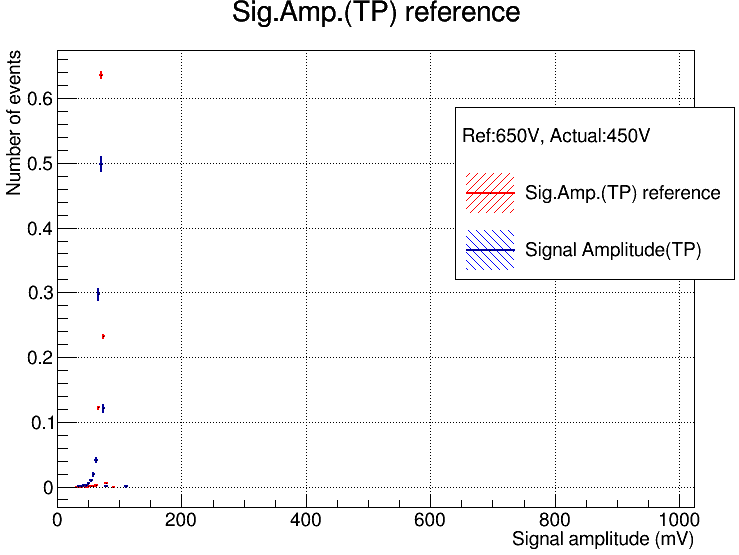
looks like this:
Thank You!