Histogram Painting with BAR option on Log Scale

Hello,

Sorry in advance for the not-so-minimal example.
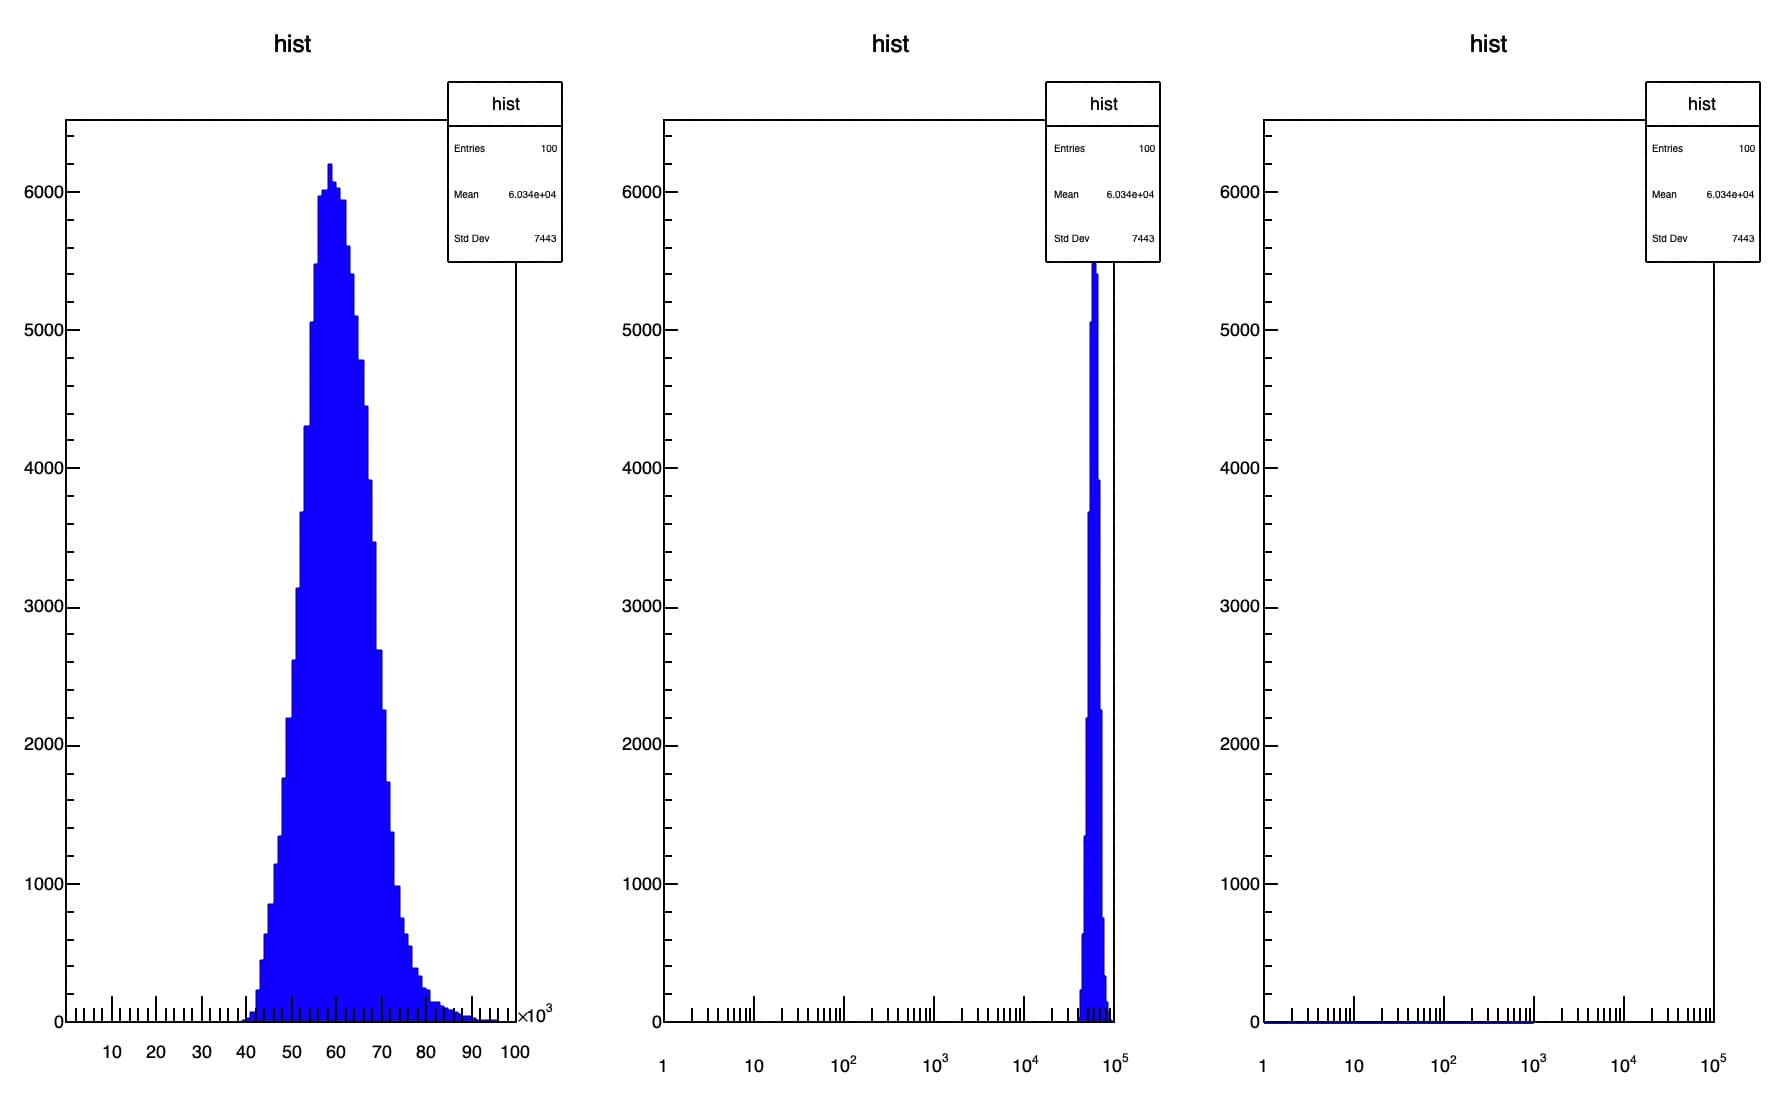
I have an issue where the histograms don’t seem to render with a “B” option, but render okay with other options and a non-logx scaling. The below is an example. This affects all of my plots under the same binning.

import numpy as np
import ROOT

h = ROOT.TH1D("hist", "hist", 100, np.logspace(0, 9, 101, dtype=float))

content = np.array([0.000e+00, 0.000e+00, 0.000e+00, 0.000e+00, 0.000e+00, 0.000e+00,
       0.000e+00, 0.000e+00, 0.000e+00, 0.000e+00, 0.000e+00, 0.000e+00,
       0.000e+00, 0.000e+00, 0.000e+00, 0.000e+00, 0.000e+00, 0.000e+00,
       0.000e+00, 0.000e+00, 0.000e+00, 0.000e+00, 0.000e+00, 0.000e+00,
       0.000e+00, 0.000e+00, 0.000e+00, 0.000e+00, 0.000e+00, 0.000e+00,
       0.000e+00, 0.000e+00, 0.000e+00, 0.000e+00, 0.000e+00, 3.000e+00,
       2.000e+00, 5.000e+00, 3.000e+00, 1.300e+01, 3.300e+01, 7.300e+01,
       2.350e+02, 4.480e+02, 6.330e+02, 8.480e+02, 1.137e+03, 1.353e+03,
       1.768e+03, 2.193e+03, 2.624e+03, 3.139e+03, 3.688e+03, 4.302e+03,
       5.062e+03, 5.473e+03, 5.969e+03, 6.010e+03, 6.204e+03, 6.074e+03,
       6.026e+03, 5.942e+03, 5.611e+03, 5.400e+03, 5.106e+03, 4.791e+03,
       4.450e+03, 3.919e+03, 3.468e+03, 2.696e+03, 2.257e+03, 1.743e+03,
       1.369e+03, 9.900e+02, 7.580e+02, 6.330e+02, 5.520e+02, 3.990e+02,
       3.410e+02, 2.480e+02, 2.350e+02, 1.480e+02, 1.510e+02, 1.150e+02,
       1.090e+02, 8.500e+01, 6.800e+01, 5.500e+01, 4.800e+01, 4.200e+01,
       2.800e+01, 2.000e+01, 1.700e+01, 1.800e+01, 2.100e+01, 1.000e+01,
       5.000e+00, 8.000e+00, 5.000e+00, 5.000e+00])

for i in range(h.GetNbinsX()):
    h.SetBinContent(i+1, content[i])
    # print(f"Bin {i+1}: {h.GetBinContent(i+1)}")


h.SetFillColor(ROOT.kBlue)
h.SetLineColor(ROOT.kBlue)
h.SetMarkerColor(ROOT.kBlue)
h.SetMarkerStyle(ROOT.kFullCircle)

c = ROOT.TCanvas("c", "c", 800, 600)
c.SetLogx()
# h.SetMinimum(3) # Setting a minimum value for the y-axis doesn't work with log scale
h.Draw("HIST B")
# h.Draw("P SAME") # This seems to draw the markers okay
c.Draw()
c.SaveAs("Test.pdf")

Please let me know for anything else.

Thanks.

I’ll check

Yes option B with logx has a problem:

void drawHistogram() {
    TH1D *h = new TH1D("hist", "hist", 100, 1, 100000);
    // Content for the histogram
    Double_t content[] = {
        0.000e+00, 0.000e+00, 0.000e+00, 0.000e+00, 0.000e+00, 0.000e+00,
        0.000e+00, 0.000e+00, 0.000e+00, 0.000e+00, 0.000e+00, 0.000e+00,
        0.000e+00, 0.000e+00, 0.000e+00, 0.000e+00, 0.000e+00, 0.000e+00,
        0.000e+00, 0.000e+00, 0.000e+00, 0.000e+00, 0.000e+00, 0.000e+00,
        0.000e+00, 0.000e+00, 0.000e+00, 0.000e+00, 0.000e+00, 0.000e+00,
        0.000e+00, 0.000e+00, 0.000e+00, 0.000e+00, 0.000e+00, 3.000e+00,
        2.000e+00, 5.000e+00, 3.000e+00, 1.300e+01, 3.300e+01, 7.300e+01,
        2.350e+02, 4.480e+02, 6.330e+02, 8.480e+02, 1.137e+03, 1.353e+03,
        1.768e+03, 2.193e+03, 2.624e+03, 3.139e+03, 3.688e+03, 4.302e+03,
        5.062e+03, 5.473e+03, 5.969e+03, 6.010e+03, 6.204e+03, 6.074e+03,
        6.026e+03, 5.942e+03, 5.611e+03, 5.400e+03, 5.106e+03, 4.791e+03,
        4.450e+03, 3.919e+03, 3.468e+03, 2.696e+03, 2.257e+03, 1.743e+03,
        1.369e+03, 9.900e+02, 7.580e+02, 6.330e+02, 5.520e+02, 3.990e+02,
        3.410e+02, 2.480e+02, 2.350e+02, 1.480e+02, 1.510e+02, 1.150e+02,
        1.090e+02, 8.500e+01, 6.800e+01, 5.500e+01, 4.800e+01, 4.200e+01,
        2.800e+01, 2.000e+01, 1.700e+01, 1.800e+01, 2.100e+01, 1.000e+01,
        5.000e+00, 8.000e+00, 5.000e+00, 5.000e+00
    };

    // Fill the histogram with content
    for (int i = 0; i < h->GetNbinsX(); ++i) {
        h->SetBinContent(i + 1, content[i]);
    }

    // Set histogram styles
    h->SetFillColor(kBlue);

    // Create a canvas and draw the histogram
    TCanvas *c = new TCanvas("c", "c", 900, 600);
    c->Divide(3,1);
    c->cd(1);
    h->Draw();
    c->cd(2)->SetLogx();
    h->Draw();
    c->cd(3)->SetLogx();
    h->Draw("B");
}

Note the option “BAR” is working fine with log X.

I think I found something but I need more instigations in order to propose a fix. Right now I am using the follwing macro to debug:

void drawHistogram() {
   gStyle->SetOptStat(0);
   THStack *hs = new THStack("hs","hs");
   TH1D *h1 = new TH1D("h1", "h1", 6, 1, 100000);
   TH1D *h2 = new TH1D("h2", "h2", 6, 1, 100000);
   Double_t content[] = {10, 20, 30, 30, 20, 10};

   for (int i = 0; i < h1->GetNbinsX(); ++i) {
      h1->SetBinContent(i + 1, content[i]);
      h2->SetBinContent(i + 1, content[i]);
   }

   hs->Add(h1);
   hs->Add(h2);

   h1->SetFillColor(kBlue);
   h2->SetFillColor(kRed);

   TCanvas *c = new TCanvas("c", "c", 900, 600);
   c->Divide(3,1);
   c->cd(1);
   h1->Draw();
   c->cd(2)->SetLogx();
   h2->Draw();
   c->cd(3)->SetLogx();
   hs->Draw("nostackb");
}

Thanks @couet .

I don’t want to move to a THStack option at the minute.
I’ll use the BAR option instead. Marking that as a solution for now.
Let me know for anything else.

Thanks again.

I incorporated THStack in the test because I found in the code history that the problem might have been introduced with the option nostackb. We need a fix which doesn’t break this option. I am on it.

This PR fixes the problem. Thanks to have seen it.

1 Like