faca87
September 28, 2022, 12:49pm
1
Hello, I usually store my GEANT4 outputs on ROOT files. Unfortunately, my new tutor can’t use ROOT (I don’t know wich toolkit he uses.), then I added the possibility in my simulation to save data also in txt file. Here an example of the txt file:
I also wrote a ROOT macro to get data from this file and plotting a histogram. Here the macro:depenetxt.cpp (2.2 KB)
Nevertheless my tutor wants a binned txt file made of twocolumnss:
First column: Energy values binned as 1keV
Second column: The counts
Is it possible to modify my macro in order to do it? I mean the macro must write the values of the plot in a txt file instead of plotting them in a graph.
couet
September 28, 2022, 1:09pm
2
Simply make a loop on the histogram bins an print the bin center and the bin content.
faca87
September 28, 2022, 1:19pm
3
hello @couet can you show a piece of code please?
couet
September 28, 2022, 1:44pm
4
void depenetxt()
{
double DepEne; //Released energy
int entry=1;
gSystem->mkdir(TString::Format("simulazione" ), kTRUE);
TGaxis::SetMaxDigits(3);
FILE * infile = fopen("DepositedEnergyData.txt", "r");
FILE * outfile = fopen("out.txt", "w");
if (infile==NULL) {
printf("Error opening file");
exit(1);
}
TCanvas *c0 = new TCanvas("c0","c0",1280,1024);
int num=57;
c0->SetLogy();
TH1F *histo = new TH1F("histo","DepositedEnergy",2500,0.,2500);
while( fscanf(infile,"%lf",&DepEne)==1) {
entry=entry+1;
histo->Fill(DepEne);
}
histo->SetTitle("");
gStyle->SetTitleFontSize(0.08);
histo->GetXaxis()->SetTitle("Energy (keV)");
histo->GetYaxis()->SetTitle("Counts");
histo->GetYaxis()->SetTitleSize(40);
histo->GetYaxis()->SetTitleFont(43);
histo->GetYaxis()->SetTitleOffset(1);
histo->GetYaxis()->SetLabelFont(43);
histo->GetYaxis()->SetLabelSize(40);
histo->GetXaxis()->SetTitleSize(40);
histo->GetXaxis()->SetTitleFont(43);
histo->GetXaxis()->SetTitleOffset(1.1);
histo->GetXaxis()->SetLabelFont(43);
histo->GetXaxis()->SetLabelSize(40);
histo->SetStats(0);
histo->Draw("");
for (int i=1; i<=2500; i++) {
fprintf(outfile,"%g %g \n",histo->GetBinCenter(i),histo->GetBinContent(i));
}
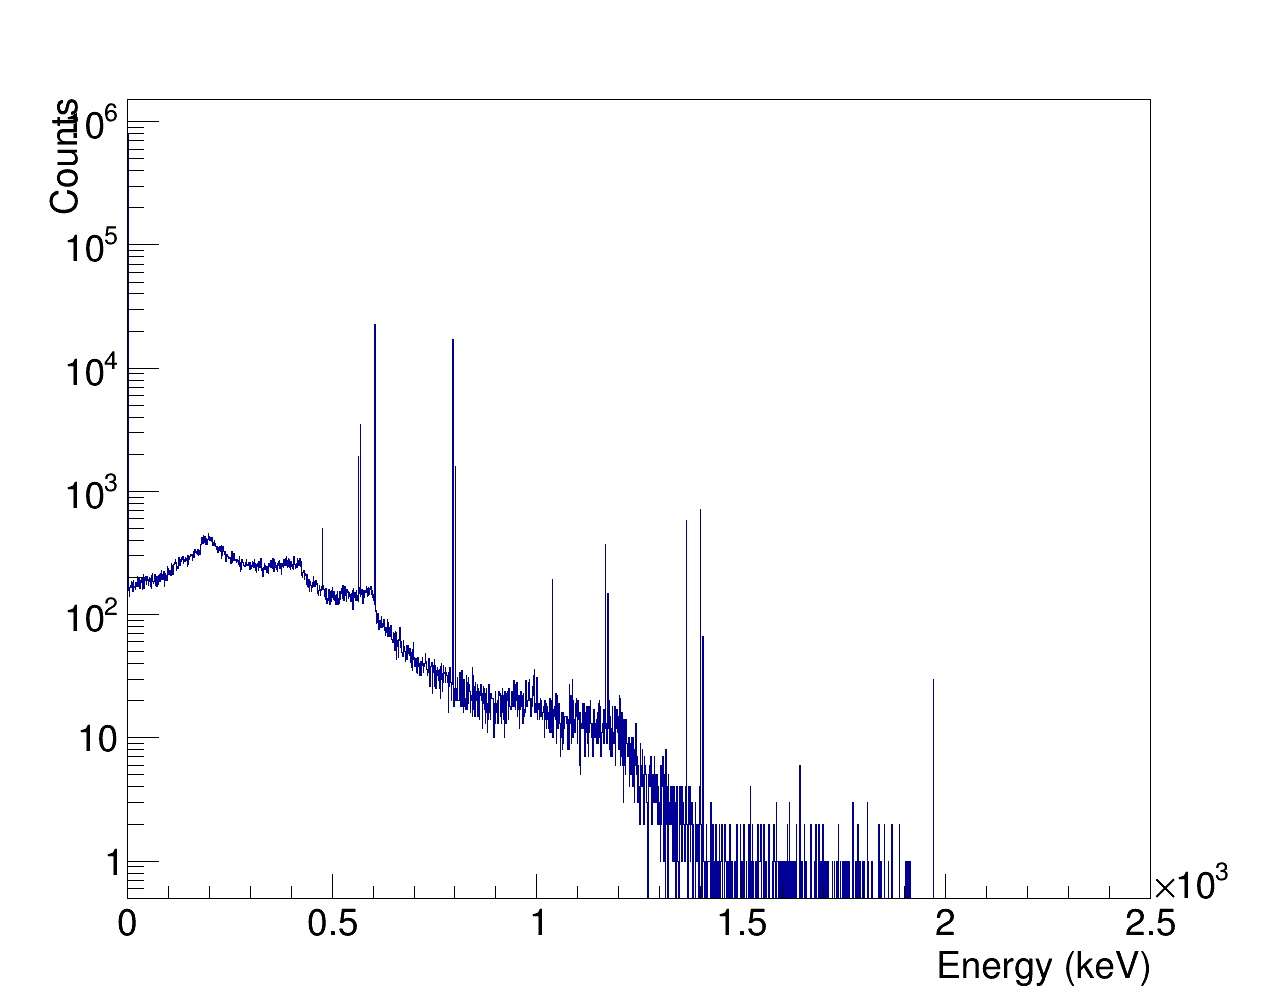
c0->Print("DepositedEnergytxt.png");
}
faca87
September 28, 2022, 2:52pm
5
Thank you, I tried your code getting this file
out.txt (26.3 KB)
but the file doesn’t look like fitting the plot
and stops at 2386keV instead of 2500
Moreover, I tried to make a general macro
by definingint binmax = histo->GetMaximumBin();
and replacing your code by
 for (int i=1; i<=binmax; i++) {
      fprintf(outfile,"%g %g \n",histo->GetBinCenter(i),histo->GetBinContent(i));
but in this case, it doesn’t write the results
do you know the reason?depenetxt.cpp (2.4 KB)
couet
September 28, 2022, 3:02pm
6
It does exactly … look at the file each bins are correct. Do not forget you asked for lg scale on Y !
faca87
September 28, 2022, 3:28pm
7
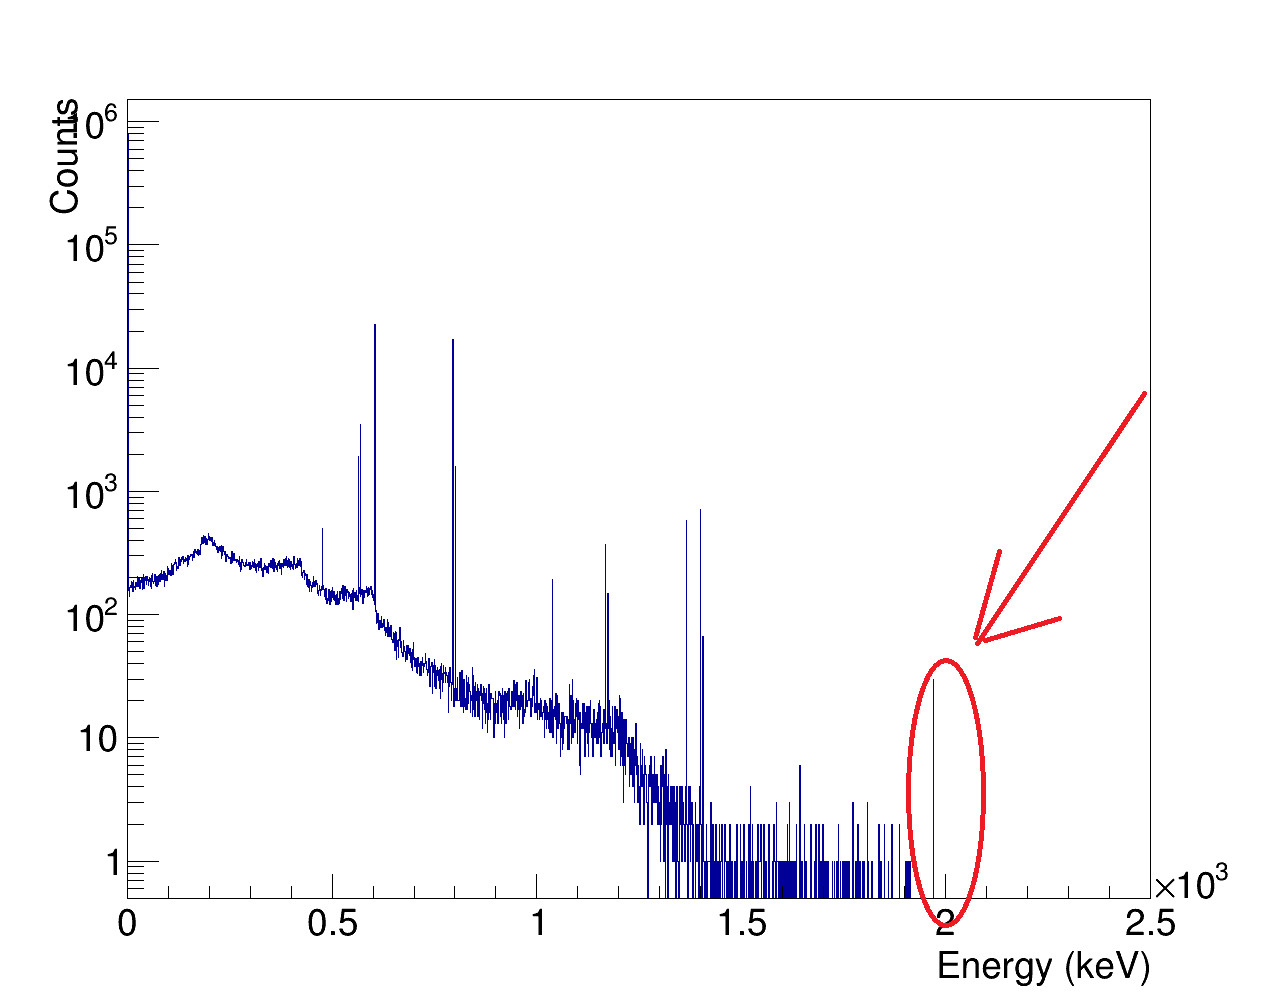
I mean, for example, in the graph I’ve (look the circle) approximately 80-90 counts
it should be the bin 1969.5 of the file, …but in the file I’ve only 30 counts instead of 80-90.
Regarding the definition of
int binmax = histo->GetMaximumBin();
do you know the reason because it doesn’t work?
couet
September 28, 2022, 3:47pm
8
nope … it is 30, look at the graph … in log scale …
faca87
September 28, 2022, 4:00pm
9
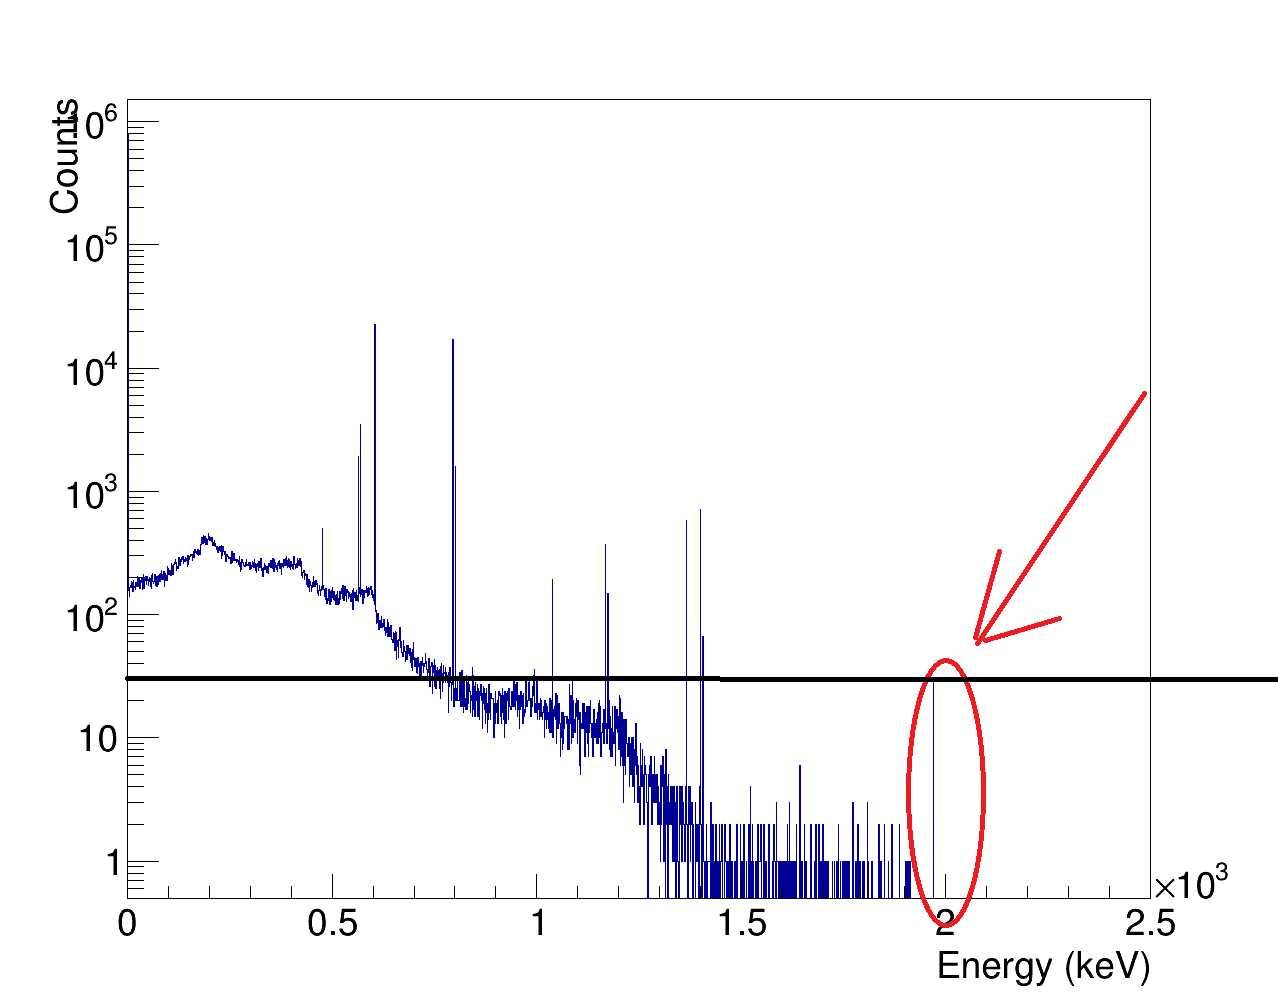
Ok, I think I need to change my glasses, because I saw the peak up to 80-90…
Now I painted a line at counts =30 and you are right…it is exactly 30! sorry…I will book an eye examination