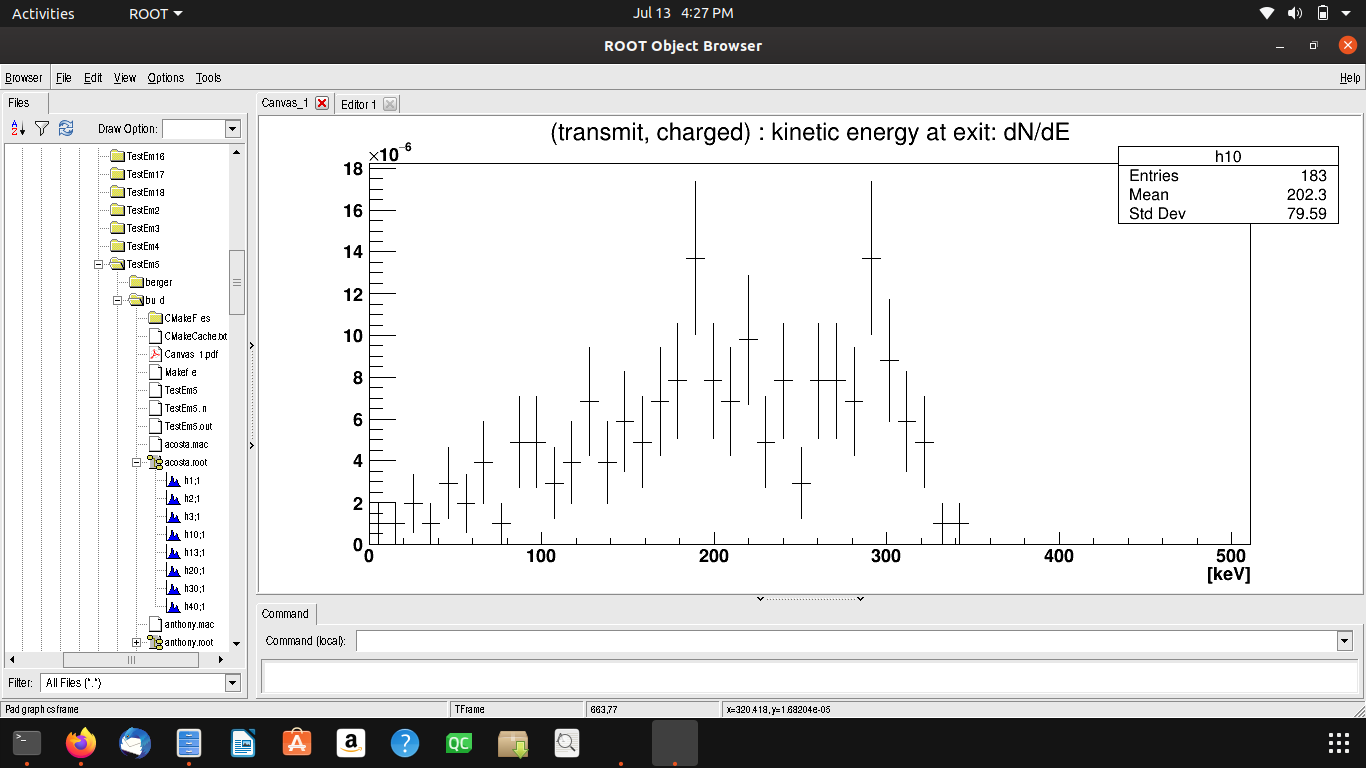
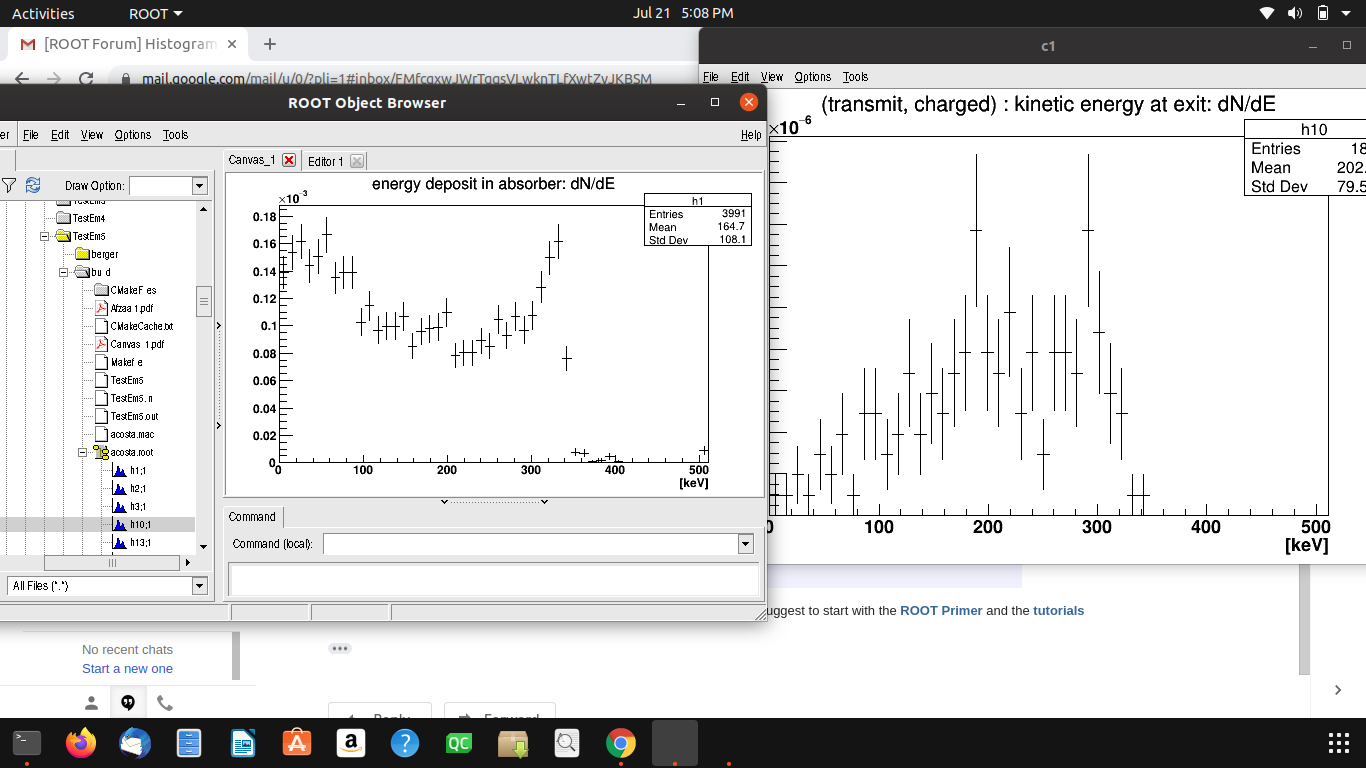
Hi, I am quite new at ROOT and trying to normalize two histograms in single plot but don’t know how to do it. I have attached the two selected histograms that i want to normalize. Please suggest possible solutions.
Thanks for your time and consideration.
unnamed.pdf (14.6 KB)
h20.pdf (14.3 KB)
Did you try to search the forum?
Yes, but I didn’t find any appropriate solution.
Could you post the code producing the histograms?
Code?
Yes, the source code producing those histograms. I.e. how did you generate those histograms?
Oh, OK, thanks. I’ll try to come with a working solution
Thanks. I am waiting…
In fact, do you really want to normalize them, or simply draw them both in the same canvas? If you just want to draw several histograms in the same canvas, simply use the SAME option of the TH1::Draw(), otherwise you should really try the different methods of normalizing histograms, as described in this topic, for example
Could you please give me direct commands to draw both histograms in same canvas and to normalize them? As i can’t figure out it.
Thanks
Something like this:
{
   // open the ROOT file
   TFile *f = TFile::Open("acosta.root");
   // check the validity of the file
   if ((!f) || f->IsZombie()) {
      std::cout << "Failed to open acosta.root!" << std::endl;
      return;
   }
   // create a canvas
   TCanvas *c1 = new TCanvas("c1", "c1");
   // get the first histogram from the file
   TH1F *h1 = (TH1F *)f->Get("h1");
   // get the second histogram from the file
   TH1F *h2 = (TH1F *)f->Get("h2");
   // display the first histogram
   h1->Draw();
   // display the second histogram with the option "SAME"
   h2->Draw("SAME");
}
And change the file or histogram names following your needs. I would also suggest to start with the ROOT Primer and the tutorials
Thanks for your response!
I tried by this program it opened histograms in a new canvas c1(see screenshot). How can I normalize them?
// create a canvas TCanvas *c1 = new TCanvas(“c1”, “c1”); // get the first histogram from the file TH1F *h1 = (TH1F *)f->Get(“h1”); // get the second histogram from the file TH1F *h2 = (TH1F *)f->Get(“h2”); // display the first histogram h1->Draw(); // display the second histogram with the option “SAME” h2->Draw(“SAME”);
Maybe @couet can explain how to normalize histograms…
Hi,
To normalize histogram use TH1::Scale. For example, to normalise such that the sum of all bins is equal to 1, do:
histogram->Scale(1./histogram->Integral() );
See also Normalize a histogram