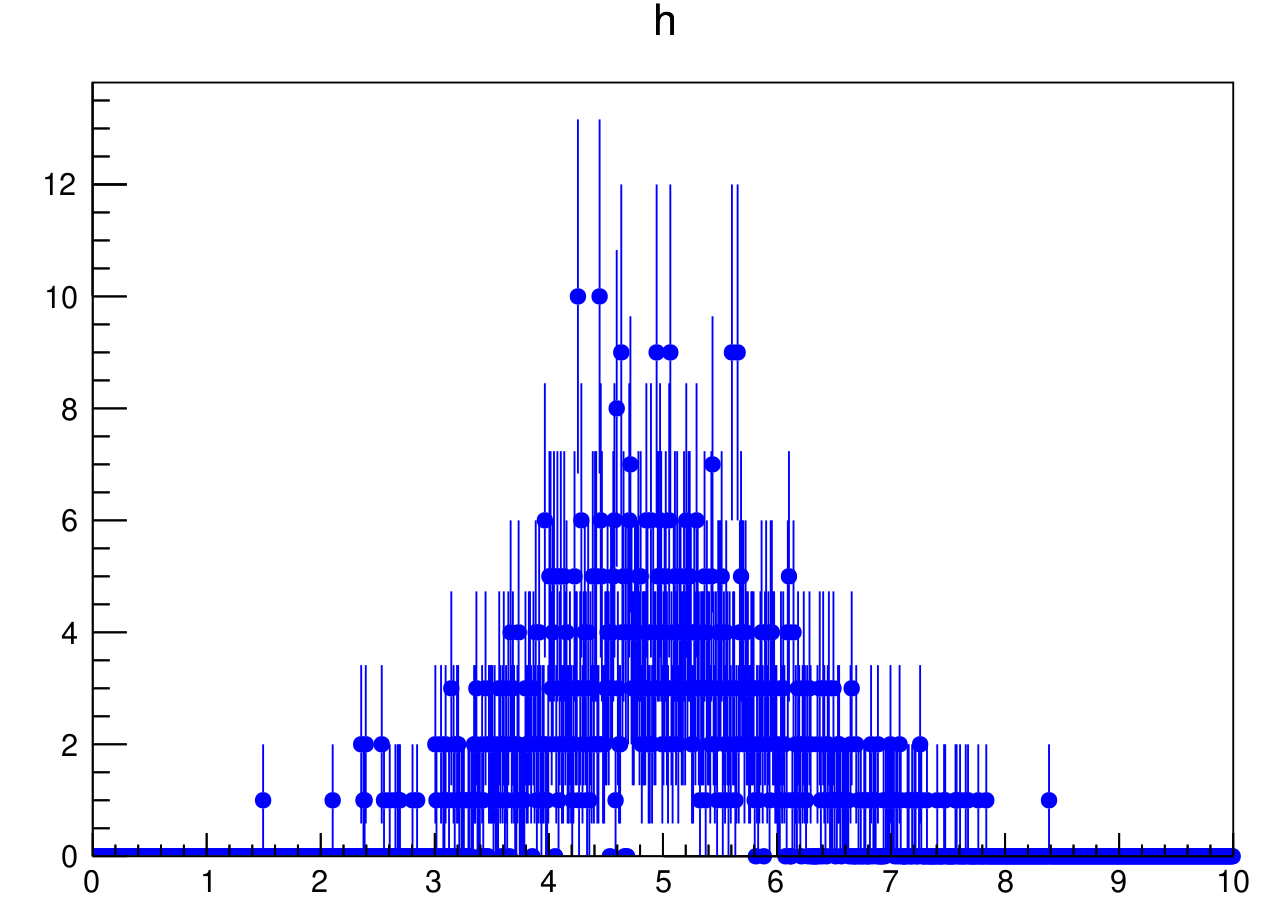
I am trying to plot a histogram which contains bins of value 0 (or close to 0), and plotting markers (using Draw(“e0p”)) of custom size makes them clip through the axis of the plot (figure attached). Is there an option where the parts below the axis line are not drawn (only the segment above the line is visible). I would like to avoid changing the range of the y-axis to be able to squeeze in the markers within bounds. Is there a way to achieve this?
Thanks!
Vangi
No, the markers are either drawn entirely or not drawn. One possible way would be to define a wider Y range so the marker are entirely above the X axis.
Hello,
I am trying to implement a poor version of this by inserting a white TBox below the histogram and redrawing the axis, but I am not sure if there is a way of redrawing the axis labels and title (similar togPad->RedrawAxis();). Does something like that exist?
Cheers,
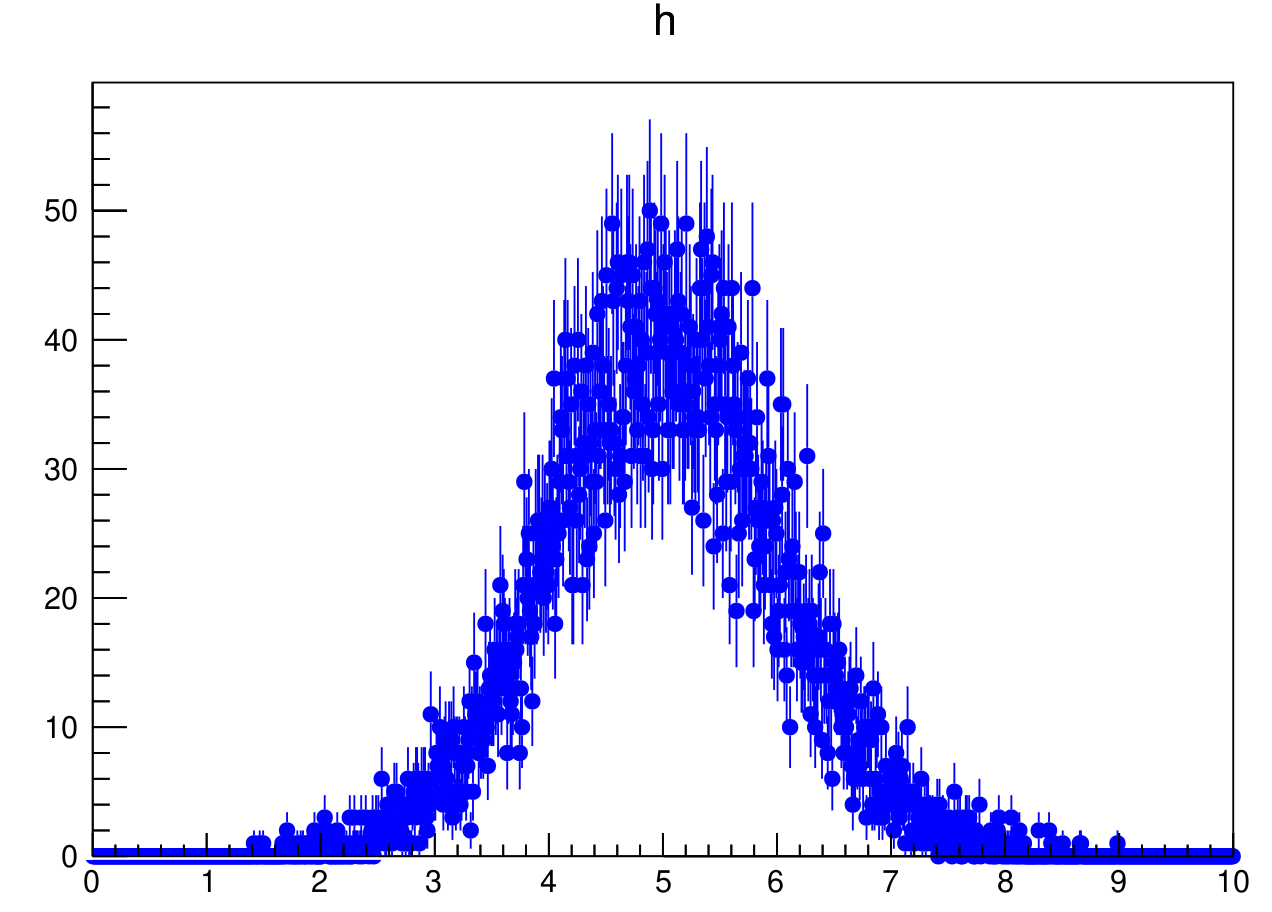
Thank you for having a look. Here is an example script which generates a histogram and prints it into a pdf. What I get by default can be seen on the right hand side of the plot (x-axis range 5-10), and what I am trying to do corresponds to the left side of the plot (x-axis values of 0-5). I have intentionally offset the labels of the axes so there is no overlap between the markers and the labels (so that I am able to cover the markers completely with the boxes, but not the axis labels). Ideally I would like to keep the labels in any position, and the way (if there is any) of doing it is to redraw the labels on top of the masking box, if they are forced to overlap. It also seems the size of the boxes should be a function of other things, as if increase the loop by 10x, the box does not cover the whole markers anymore. Figures attached.