I am trying to draw 3 histograms on the same canvas. The problem is with the first histogram (V2hist_rebin1). It is not there in the canvas. Only two histograms are there. But when I write it to root file it works. ( Actually it is *V2hist_rebin1 )
gStyle->SetOptStat(kFALSE);
// Declaring New Rebin histograms
TProfile *V2hist_rebin1 = (TProfile *) V2hist->Rebin(5, "V2hist_rebin1");
TProfile *V2hist211_rebin = (TProfile *) V2hist->Rebin(5, "V2hist211_rebin");
TProfile *V2hist2212_rebin = (TProfile *) V2hist2212->Rebin(5, "V2hist2212_rebin");
// **************** Setting Histogram Axis Title*********************
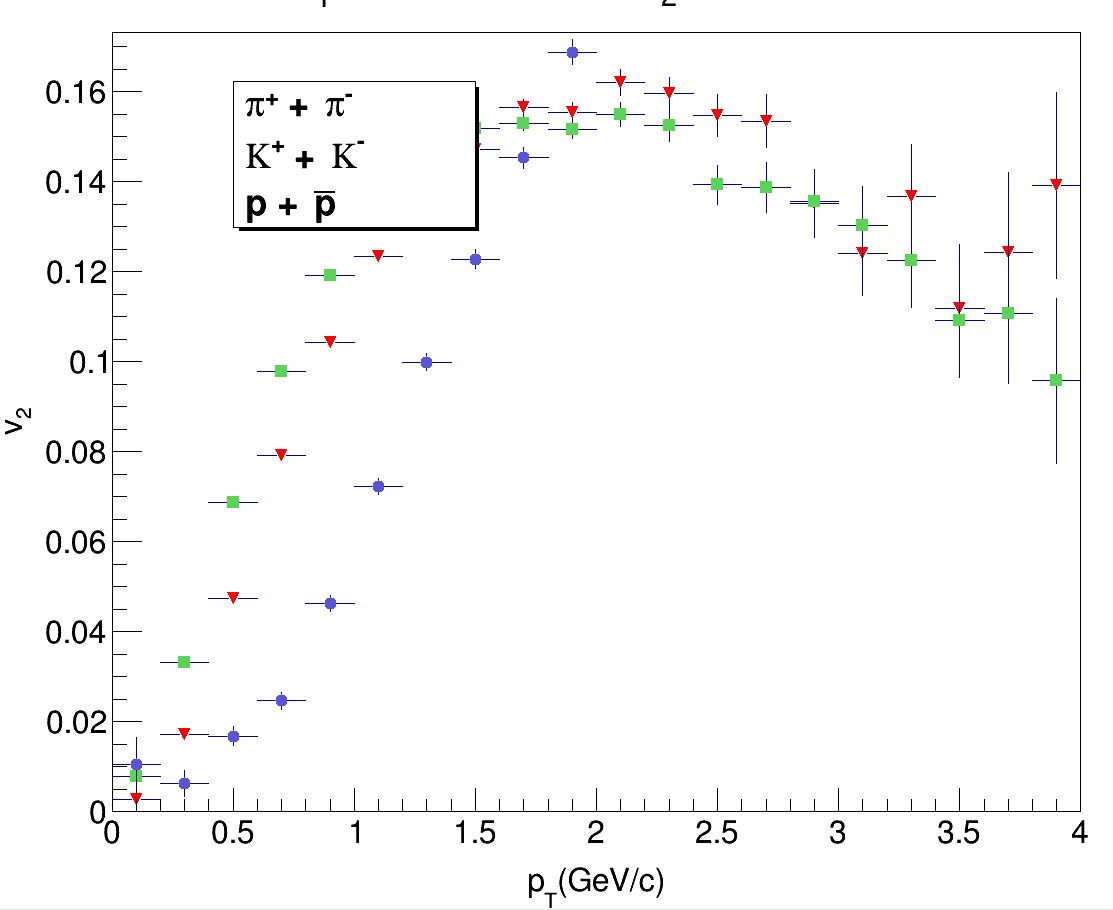
V2hist_rebin1->SetTitle("p_{T} dependence of v_{2} for '#Kappa^{+} + #Kappa^{-}'");
V2hist_rebin1->SetMarkerStyle(kFullTriangleDown);
V2hist_rebin1->SetMarkerColor(20);
V2hist_rebin1->SetMarkerSize(1.4);
V2hist_rebin1->GetYaxis()->SetTitleOffset(1.4);
V2hist_rebin1->GetYaxis()->CenterTitle(true);
V2hist_rebin1->GetYaxis()->SetTitle("v_{2}");
V2hist_rebin1->GetXaxis()->SetTitleOffset(1.4);
V2hist_rebin1->GetXaxis()->CenterTitle(true);
V2hist_rebin1->GetXaxis()->SetTitle("p_{T}(GeV/c)");
// Setting Pion Markers
V2hist211_rebin->SetMarkerStyle( kFullSquare);
V2hist211_rebin->SetMarkerSize(1.4);
V2hist211_rebin->SetMarkerColor(8);
//// Setting Proton Markers
V2hist2212_rebin->SetMarkerStyle(kFullCircle);
V2hist2212_rebin->SetMarkerSize(1.4);
V2hist2212_rebin->SetMarkerColor(9);
TCanvas *Ell_flow = new TCanvas ("Elliptic Flow kaon","flow",15,15,700,500);
V2hist_rebin1->Draw();
V2hist211_rebin->Draw("same");
V2hist2212_rebin->Draw("same");
Thank you
Well, “V2hist_rebin1” seems to be equal to “V2hist211_rebin” so remove V2hist211_rebin->Draw(“same”); and you will see the first one.
BTW. When you post “output” or “source code” here, do remember to enclose them into two lines which contain just three characters ``` (see how your posts have been edited above).
Hello Wile,
You can see the blue dotted curve.
couet
October 12, 2017, 8:13am
5
How have you done that ? nor the X axis or the Y xis have a such range.
1 Like
Try:
THStack *hs = new THStack("hs", "p_{T} dependence of v_{2} for '#Kappa^{+} + #Kappa^{-}';p_{T}(GeV/c);v_{2}");
hs->Add(V2hist_rebin1);
hs->Add(V2hist211_rebin);
hs->Add(V2hist2212_rebin);
hs->Draw("nostack");
2 Likes
Can you please tell how to join these data points with the lines.
couet
October 12, 2017, 1:32pm
9
hs->Add(V2hist_rebin1, "L");
hs->Add(V2hist211_rebin, "L");
hs->Add(V2hist2212_rebin, "L");
1 Like
couet
October 12, 2017, 1:37pm
11
can you post you macro here ?
// Declaring New Rebin histograms
V2hist_rebin = (TProfile *)       V2hist -> Rebin(5, "V2hist_rebin");
V2hist211_rebin = (TProfile *)    V2hist211 -> Rebin(5, "V2hist211_rebin");
V2hist2212_rebin = (TProfile *)   V2hist2212 -> Rebin(5, "V2hist2212_rebin");
// Setting Pion Markers
V2hist211_rebin->SetMarkerStyle( kFullSquare);
V2hist211_rebin->SetMarkerSize(1.4);
V2hist211_rebin->SetMarkerColor(8);
//// Setting Proton Markers
V2hist2212_rebin->SetMarkerStyle(kFullCircle);
V2hist2212_rebin->SetMarkerSize(1.4);
V2hist2212_rebin->SetMarkerColor(9);
//======================================
V2hist_rebin->SetMarkerStyle(kStar);
V2hist_rebin->SetMarkerColor(kRed);
V2hist_rebin->SetMarkerSize(1.4);
TCanvas *Ell_flow = new TCanvas ("Elliptic Flow kaon","flow",15,15,700,500);
THStack *hs = new THStack("hs", "p_{T} dependence of v_{2} for '#Kappa^{+} + #Kappa^{-}';p_{T}(GeV/c);v_{2}");
hs->Add(V2hist_rebin, "L");
hs->Add(V2hist211_rebin, "L");
hs->Add(V2hist2212_rebin, "L");
hs->Draw("nostack");
couet
October 12, 2017, 1:44pm
13
I cannot runt that …
Anyway try:
hs->Add(V2hist_rebin, "HIST L");
hs->Add(V2hist211_rebin, "HIST L");
hs->Add(V2hist2212_rebin, "HIST L");
1 Like
Yes!! It worked. But there are only lines without data points with same color. Can we do something for it? I need data points too with different colors ( as you can see in the above graph)
couet
October 12, 2017, 1:54pm
16
Yes … good you found it yourself
1 Like
system
October 26, 2017, 1:54pm
17
This topic was automatically closed 14 days after the last reply. New replies are no longer allowed.


 …
…