Hello,
I am trying to do the simplest thing ever - read the histogram from an ntuple and simply draw it with RDataFrame.
I am using this code:
using namespace ROOT;
void test(){
RDataFrame df("Events", "tree_1.root");
auto hist = df.Histo1D("Muon_pt");
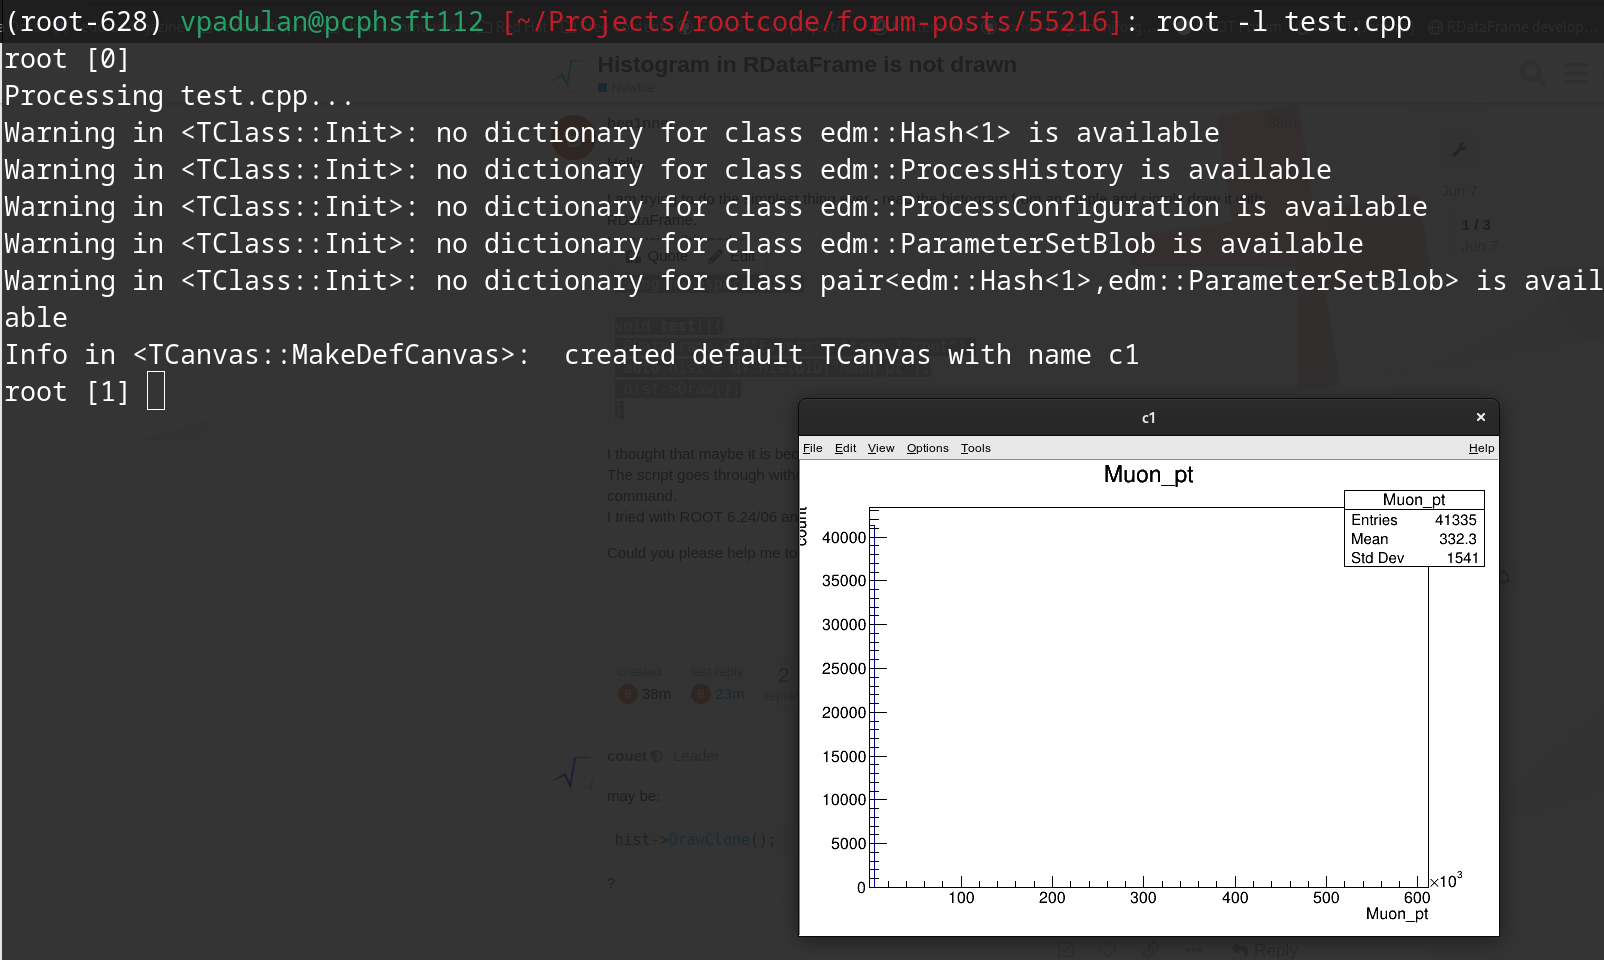
hist->Draw();
}
I thought that maybe it is because of absent TCanvas, but I also tried it that way - still does not work. The script goes through without errors, but there is no output. I am using simply root -l test.cpp command.
I tried with ROOT 6.24/06 and 6.24/08.
Could you please help me to figure out what’s wrong? Thank you!!