I’m trying to draw two histograms (h1) on the same canvas from two different root files(1.root and 2.root). I used two macros (1.C and 2.C) but both are resulting in error.1.root (36.8 KB) 2.root (37.0 KB)
Macro files used:
{

    TFile *f1 = TFile::Open("1.root");
    TH1D *h1= (TH1D*)f1->Get("h1");
    h1->Draw("hist l");
    h1->SetLineWidth(3);
    h1->SetLineColor(2);

    TFile *f2 = TFile::Open("2.root");
    TH1D *h2 = (TH1D*)f2->Get("h1");
    h2->SetLineWidth(2);
    h2->SetLineColor(4);
    h2->Draw("hist l same");

}
2.C
{


TFile *f2 = TFile::Open("1.root");
TCanvas *c2 = (TCanvas*)f2->Get("h1");
h1->Draw("hist same");
h1->SetName("aa");
aa->SetLineStyle(7);
aa->SetMarkerStyle(23);
aa->SetLineColor(4);
aa->SetLineWidth(2);

TFile *f3 = TFile::Open("2.root");
TCanvas *c3 = (TCanvas*)f3->Get("h1");
h1->Draw("hist same");
h1->SetName("in");
in->SetLineStyle(9);
in->SetMarkerStyle(20);
in->SetLineColor(2);
in->SetLineWidth(2);


leg = new TLegend(0.51,0.69,0.9,0.9);
   leg->SetHeader("beam");
   leg->AddEntry(in,"2","l");
   leg->AddEntry(aa, "1","l");
   leg->SetFillColor(10);
   leg->Draw();

}
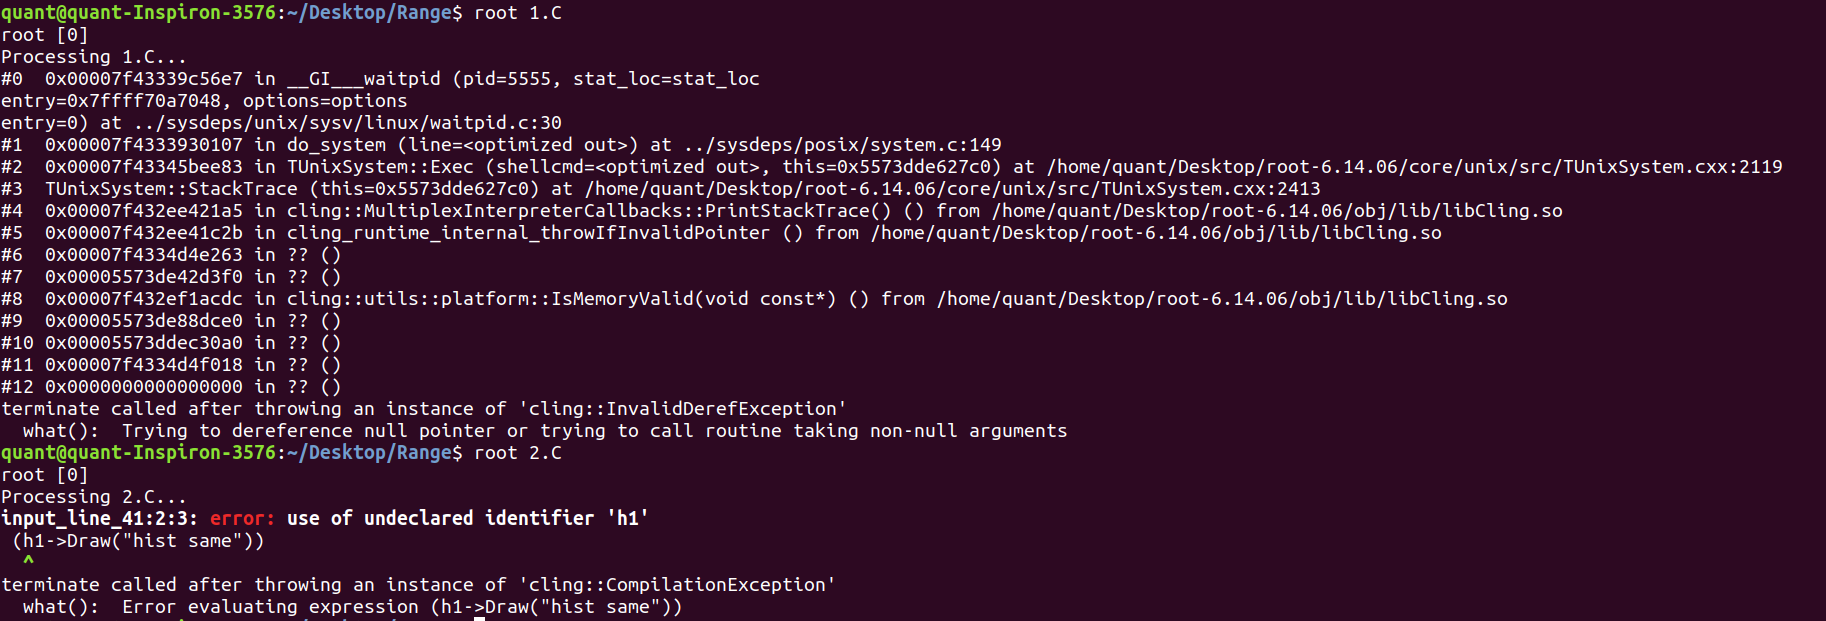
Error:
I dont know what causing an error (possibly different y axis range) because these macro file works fine with other files having same parameter.
Looking forward to hearing from expert root users.
ROOT Version: 6.14.06Platform: Ubuntu/LinuxCompiler: Not Provided
In your root files, the histograms are called 1, 2,…, not h1, h2,…
TH1D *h1= (TH1D*)f1->Get("1");
linev
August 11, 2020, 9:24am
3
Hi,
You have several problems in the macros.
{
TFile *f1 = TFile::Open("1.root");
TH1D *h1= (TH1D*)f1->Get("1");
h1->SetLineWidth(3);
h1->SetLineColor(2);
h1->Draw("hist l");

TFile *f2 = TFile::Open("2.root");
TH1D *h2 = (TH1D*)f2->Get("1");
h2->SetLineWidth(2);
h2->SetLineColor(4);
h2->Draw("hist l same");
}
And 2.C:
{
TFile *f2 = TFile::Open("1.root");
TH1 *h1 = (TH1*)f2->Get("1");
h1->SetName("aa");
h1->SetLineStyle(7);
h1->SetMarkerStyle(23);
h1->SetLineColor(4);
h1->SetLineWidth(2);
h1->Draw("hist");

TFile *f3 = TFile::Open("2.root");
TH1 *h2 = (TH1*)f3->Get("1");
h2->SetName("in");
h2->SetLineStyle(9);
h2->SetMarkerStyle(20);
h2->SetLineColor(2);
h2->SetLineWidth(2);
h2->Draw("hist same");

leg = new TLegend(0.51,0.69,0.9,0.9);
leg->SetHeader("beam");
leg->AddEntry(h1,"2","l");
leg->AddEntry(h2, "1","l");
leg->SetFillColor(10);
leg->Draw();
}
Regards,
Thank you for pointing my silly mistake.
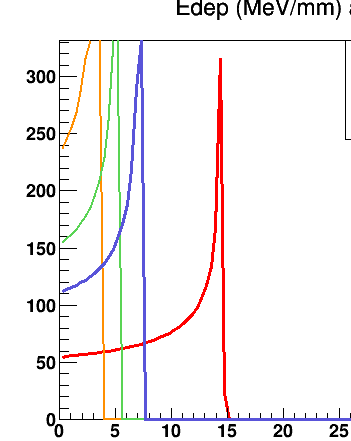
I included 2 more root files that have a high range of Y-axis. The full histogram is not confined in canvas and the upper part of the histogram is cut. How this problem can be resolved?1.root (36.8 KB) 2.root (37.0 KB) 3.root (36.0 KB) 4.root (35.3 KB)
Macro file used
{
TFile *f1 = TFile::Open(“1.root”);h1= (TH1D )f1->Get(“1”);
TFile *f6 = TFile::Open(“2.root”);h6 = (TH1D )f6->Get(“1”);
TFile *f4 = TFile::Open(“3.root”);h4 = (TH1D )f4->Get(“1”);
TFile *f5 = TFile::Open(“4.root”);h5= (TH1D )f5->Get(“1”);
leg = new TLegend(0.51,0.69,0.9,0.9);
}
Waiting for the kind reply.
linev
August 11, 2020, 10:16am
7
You should first draw histogram with maximal amplitude.THStack class which does proper alignments automatically.
Thanks, drawing the histo of maximum amplitude resolved the problem.
couet
September 1, 2020, 8:02am
9
Not that using THStack would be simpler/safer in your case. THStack computes the full range containing all histograms. You do not need to know which histogram has the bigger amplitude