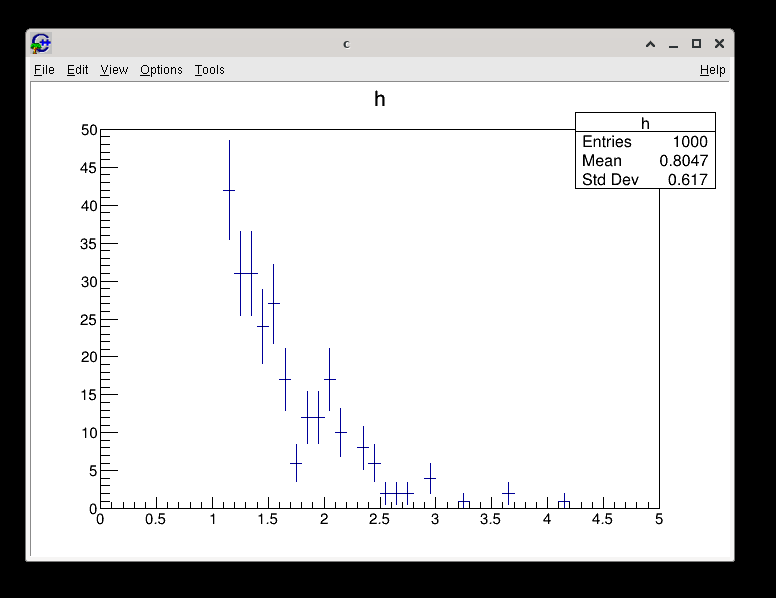
When drawing a histogram with errorbars (at least with drawing option "E") points are clipped (removed and not drawn) if the central value of the point to be drawn falls outside of the axis range, even if the length of the error bar to be drawn extends inside of the axis range.
Is there any way to prevent this clipping behaviour?
Reason being that for some datasets, the central value of some points may lie a long way from the typical spread of points. Such points which are far from the typical spread of points often also have large uncertainties/errorbars.
In such cases, it is misleading to simply not draw the point. Although the central value cannot be seen, it is often very useful to be able to see the end of the errorbar, as this indicates that a point exists beyond the range of the axis being shown.
Of course, if the errorbar does not extend into the drawing range, then neither the central value, nor the end of the errorbar will be drawn.
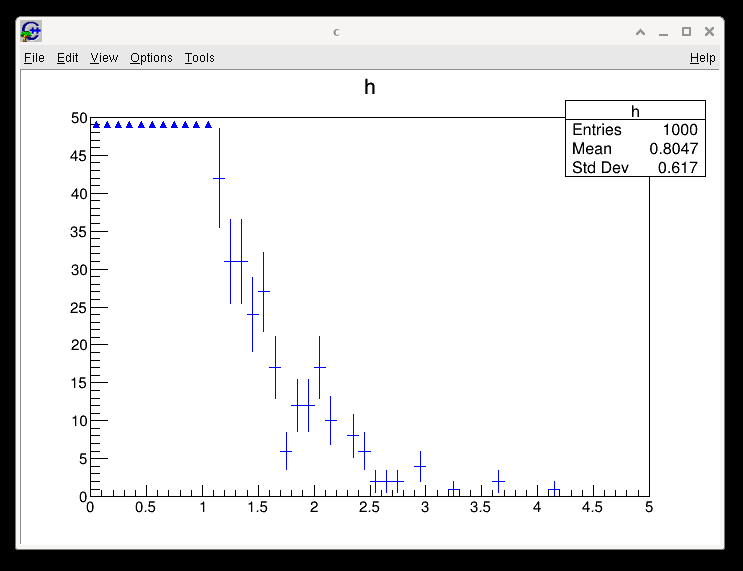
In such cases, it would be extremely useful to be able to draw a V or ^ symbol at the x-axis location of the point to indicate that the point is not seen within the current axis range. This is not something which is currently conventional (to my knowledge) however it would be a very nice new feature.
My proposal for a new drawing option, in the case that both the end of the errorbar is outside the drawable are and the central value is outside of the drawable area
… in the case of this example, some of those triangles should instead plot the end of the errorbar as it extends into the drawable area
#include <TCanvas.h>
#include <TH2.h>

int main()
{


    TCanvas *c = new TCanvas("c", "c");

    TH1D *h = new TH1D("h", "h", 50, 0.0, 5.0);
    h->FillRandom("gaus", 1000);
    h->SetMarkerColor(kBlue);
    h->SetLineColor(kBlue);

    h->SetMaximum(50);
    h->Draw("E");

    for(Int_t i = 1; i <= h->GetNbinsX(); ++ i)
    {
        Double_t content = h->GetBinContent(i);
        Double_t center = h->GetBinCenter(i);
        if(content >= 50)
        {
            TMarker *m = new TMarker(center, 49.0, 22);
            m->SetMarkerColor(kBlue);
            m->Draw();
        }
    }

    c->Show();


    return 0;

}
I see, you want some “signal” on a zoomed plot to show there is data outside the range … It looks a bit weird seems to me and it surely cannot be the default behavior. If you want to implement a such (new) option you are welcome to submit a PR. But that’s something nobody asked before.
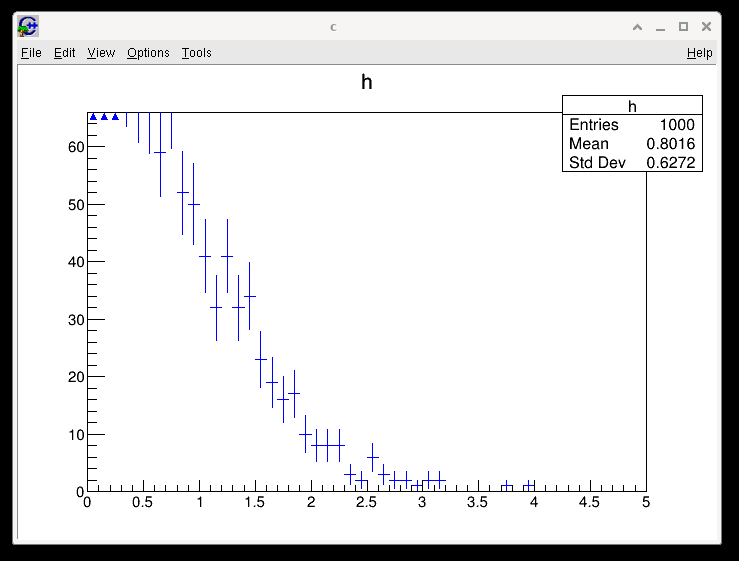
Yes, I agree for this example it is a bit strange…
Perhaps it is more logical with the following example?
You can see that for the bottom plot, the right most points have “dissappeared”.
It does not really make a whole lot of sense to zoom out further because you see less on the figure.
This example shows just a single series of data, but image ratio plots with two series of data, one which fluctuates with much greater magnitude than the other. It may be sensible in such cases to “zoom in” without clipping points from the series which exceeds the axis range.
If the points are outside because of a zoom they are not shown but the part of the errors bars in range are are shown. That’s how it is implemented now. Seems to me you are requesting a new option.
@couet This cannot be correct, at least not with all drawing options - see the example above. If you check the middle plot, you can see that there are 3 missing points, and no shaded region for the error uncertainty
The shaded area might be wrong I agree. I wiil try to reproduce this on some histogram I have. Unless you have a example ready showing the truncated shaded area.
void e2()
{
   auto ce2 = new TCanvas("ce2","ce2",600,400);
   auto he2 = new TH1F("he2","Distribution drawn with option E2",100,-3,3);
   Int_t i;
   for (i=0;i<10000;i++) he2->Fill(gRandom->Gaus(0,1));
   he2->SetFillColor(kRed);
   he2->SetMarkerStyle(20);
   he2->GetXaxis()->SetRange(40,48);
   he2->GetYaxis()->SetRangeUser(180,230);
   he2->Draw("E2");
   he2->Draw("E0 SAME");
}
In the mean time, you can switch to graphs (you can just pass your histogram to TGraphErrors constructor to get a graph filled from the histogram), they have such drawing option: