Hello, I am plotting some 2d histograms and I would like the plot to be square. In other words, the x and y axes have the same range and bin width so I want that evident in the plot. As it stands, the drawing comes out rectangular. Here is the relevant code (in python):
import ROOT as R
R.gStyle.SetOptStat(0)

pn3 = R.TH2F("PN3", "CH3 Normalized", dimx, 0, dimx, dimy, 0, dimy)

#Skipped section of code where I fill the histogram

c1 = R.TCanvas()
pn3.Draw('colz')
c1.Draw()
The result is the following image:
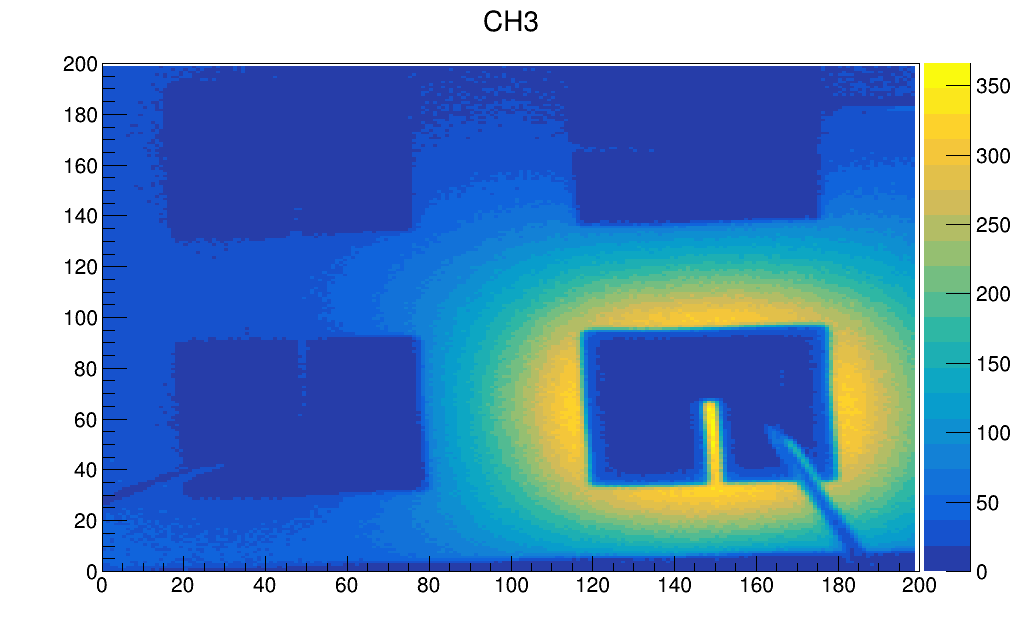
As you can see, the x-axis is longer than the y-axis and thus the image is squished a little. I think the relevant object to edit is the TFrame but I could not find anything useful in the reference guide for editing it to keep it square. Any help is appreciated!
_ROOT Version: 6.12.06
Platform: Not Provided
Compiler: Not Provided