Histogram AITOFF projection

Hello @couet,

I’ve been investigating the projection implementations in ROOT, and I noticed that there are a few functions in THistPainter to project from an XY representation to Mercator, Aitoff, etc.
However, when activating the grid on a canvas, the grid lines can become quite misleading.

How difficult would it be to draw a circular canvas instead of a square one when using these projections?

The same issue happens when drawing a TGraph onto a projected histogram. It seems that such modifications wouldn’t be too difficult to implement, since THistPainter has static methods. The projection is handled at the histogram level in THistPainter, but the grid & graphs seem to be drawn nearby TPad level. How would you handle this?

Are there any plans to update the implementation to support these kinds of features?

If possible, I want to avoid complex developments, so I am considering to draw custom overlays to provide perhaps a more comprehensive plot by painting specific TLines and TGraphs onto the outgoing canvas. :slight_smile:

However, I am uncertain of the coordinate system used once drawing the initial projection. I basically tried to plot a TGraph onto a TCanvas with and without projection, but it seems TGraph gets unexpected coordinate and paint in incorrect position as compared to axis values.

I could find THistPainter::ProjectAitoff2xy here, but it is not so clear from where this projection is called while painting the histogram.

./hist/histpainter/inc/THistPainter.h:   static  Int_t      ProjectAitoff2xy(Double_t l, Double_t b, Double_t &Al, Double_t &Ab);
./hist/histpainter/src/THistPainter.cxx:Int_t THistPainter::ProjectAitoff2xy(Double_t l, Double_t b, Double_t &Al, Double_t &Ab)
./hist/histpainter/src/THistPainter.cxx:      func = ProjectAitoff2xy;
./hist/histpainter/src/TPainter3dAlgorithms.cxx:               THistPainter::ProjectAitoff2xy(xyz[i*3 + 0], xyz[i*3 + 1], al, ab);

Also, please find a piece of code, if found to be useful for discussions.
Additionally in my example below, I have issue for zooming in the projected plot (perhaps due to colz?) after making some clicks colorbar & axis are deappearing.

#include <TGraph.h>
#include <TH2.h>
#include <THistPainter.h>
#include <TCanvas.h>
#include <TStyle.h>
#include <TColor.h>
#include <TLegend.h>
#include <cmath>

void ProjectSkymap() {

    TRandom3 rnd; rnd.SetSeed(42);

    const int fs = 256, nPoints = 1024;
    Double_t lon[nPoints], lat[nPoints];
    for (int i = 0; i < nPoints; ++i) {
        lon[i] = -180 + i * (360.0 / (nPoints - 1)); // Generate longitude values from -180 to 180

        lat[i] = 180 * cos(i * (M_PI / (nPoints - 1))); // Test A: Generate latitude values as a cose wave (out of band)
        // lat[i] = 90 * sin(i * (M_PI / (nPoints - 1))); // Test B: Generate latitude values as a sine wave
        // lat[i] = 90 * cos(i * (M_PI / (nPoints - 1))); // Test C: Generate latitude values as a cose wave
    }

    TGraph* g = new TGraph(nPoints, lon, lat);
    TH2D* hProj = new TH2D("hh", "Test Histogram", fs, -180, 180, fs, -90, 90);
    for (int i = 0; i < nPoints; ++i) {

        hProj->Fill(lon[i], lat[i]);

        double x = rnd.Uniform(-180, 180);
        double y = rnd.Uniform(-90, 90);
        hProj->Fill(x, y, 0.75);
    }

    double scaleX = 312, scaleY = scaleX/2; // ISSUE: Needs proper scaling for Aitoff projection (in this case)
    // double scaleX = 0, scaleY = scaleX/2; // Unexpected behavior (low out of scale)

    TGraph* g_proj = new TGraph();
    for (int i = 0; i < nPoints; ++i) {

        Double_t l = lon[i];
        Double_t b = lat[i];
        Double_t Al, Ab;

        THistPainter::ProjectAitoff2xy(l, b, Al, Ab);
        g_proj->SetPoint(i, Al / scaleX, Ab / scaleY);
    }

    // Create a canvas with two pads
    TCanvas *c1 = new TCanvas("c1", "Skymap Projections", 1200, 600);
    gStyle->SetOptStat(0);
    c1->Divide(2, 1);
    
    c1->cd(1);
    c1->SetGridx(1);
    hProj->SetTitle("Default Projection");
    hProj->Draw("COLZ");
    g->SetMarkerStyle(kFullCircle);
    g->SetMarkerColor(kRed);
    g->SetLineWidth(2);
    g->SetLineStyle(2);
    g->SetLineColor(kRed);
    g->Draw("L SAME");
    c1->cd(1)->Update();

    c1->cd(2);
    c1->SetGridx(1);
    hProj->SetTitle("Aitoff Projection");
    hProj->Draw("AXIS COLZ");
    hProj->Draw("AITOFF SAME");
    g_proj->SetMarkerStyle(kFullCircle);
    g_proj->SetMarkerColor(kRed);
    g_proj->SetLineWidth(2);
    g_proj->SetLineStyle(2);
    g_proj->SetLineColor(kRed);
    g_proj->Draw("L SAME");
    c1->cd(2)->Update();
}

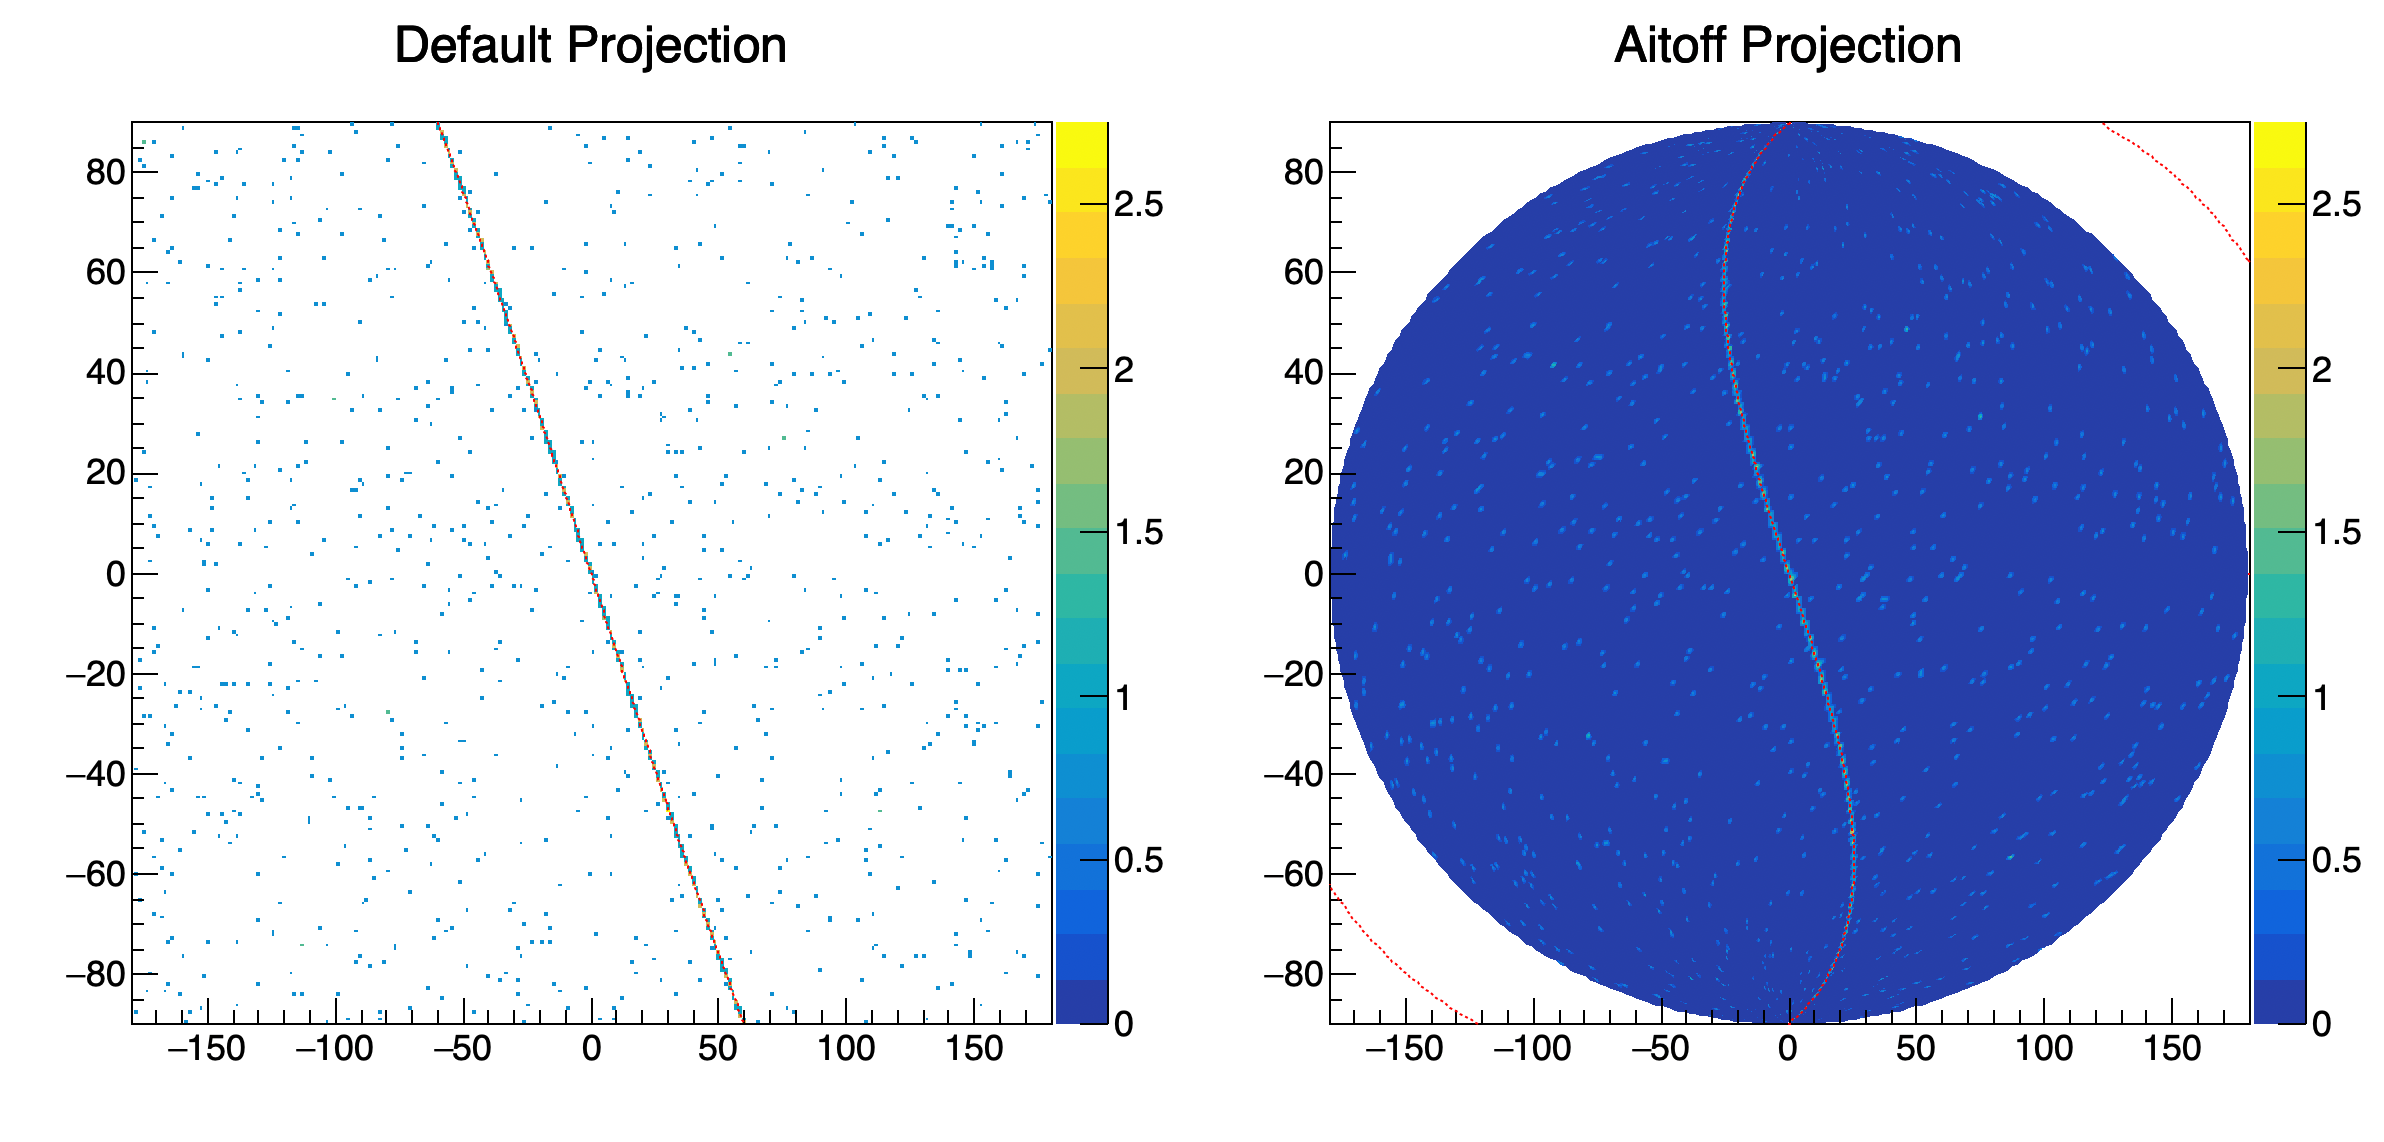
(Here is the picture of test A, the result if after stretching the graph coordinate by a specific scaling factor)

@meyerma
Thanks for your input. Indeed these projections do not change the the coordinates system and a line drawn on top of such plots ignores that such projection are used (unlike with log scale). If you need to draw a line on top of such plot you will need to compute the correct points yourself.

Yes, this projection is what I am aiming to compute. I drawn a TGraph turning to AITOFF projection, but it goes in a strange coordinate system. The red line visible in the plot is matching the histogram distribution, but I had to rescale by a factor 312 value along X and 156 along Y.

Additionally, there are few issues like how to draw COLZ at the same time as AITOFF and how to zoom in. Would you have perhaps some idea on that?

Could you give me your opinion about my reproduced, that would be very helpful.

These options cannot be used for TGraph. They are only valid in a very restrictive way with TH2 only as shown in the earth() example here: ROOT: THistPainter Class Reference
The fact these options were used for a plot is completely ignored by further graphics. Basically you can do what is shown in the earth() example and nothing more.

@couet, what do you mean by “these” options ? earth is about TH1.

See the link I sent you. I mean:

AITOFF Draw a contour via an AITOFF projection.
MERCATOR Draw a contour via an Mercator projection.
SINUSOIDAL Draw a contour via an Sinusoidal projection.
PARABOLIC Draw a contour via an Parabolic projection.

use in the earth() example in the link I sent you. They work on TH2F.
The method you are using are intenal function used by these options. They are not meant to be used directely.

I want to clarify an issue I’m seeing when combining TH1::Draw("AITOFF") and TGraph::Draw("SAME"). I don’t use the AITOFF option elsewhere — only when drawing TH2 histograms.

If you need to draw a line on top of such plot you will need to compute the correct points yourself.

You mentioned drawing/computing the correct points, this is not happening right anyway. I am drawing a TGraph() with a coordinate point at (X0,Y0) and it turns to be drawn in a difference position in local canvas space defined by X-Y axis ranges. Knowing the X-Y axis remain unchanged, as you mentioned, drawing a datapoint at (X0,Y0) must be displayed at (X0,Y0) in the canvas local space, that’s what my example illustrate.

For TGraph, I compute AITOFF projection by hand from (lon,lat) coordinates to the projected space. These THistPainter::ProjectXXX2xy are not internal to ROOT (or should be privated), they are in essence generic trigonometry formulas and I actually authored one of them in ROOT.

Anyhow, this seems to be a device space issue while using TH1::Draw("AITOFF") prior drawing TGraph::Draw() (event without THistPainter). This suggests there is either a pre-/postprocessing induced by AITOFF from histogram before plotting, but in this case I basically cannot compute the correct points by myself.

I don’t know where the drawing payload is precisely located in ROOT, so I cannot debug the plotting or understand where this pre/post processing is done (if any).

I cannot make simpler than that, data point for TGraph is not in the correct place, regardeless I use the AITOFF projection or just draw a local point (X0,Y0) at a specific place, the axis doesn’t match..

{
    const int fs = 256, nPoints = 2048;
    Double_t lon[nPoints], lat[nPoints];

    TH2D* hProj = new TH2D("hh", "Test Histogram", fs, -180, 180, fs, -90, 90);
          hProj->Fill(100, 60); // Fill with some dummy data at fixed location
    
    //
    // ISSUE: Proper scaling required to fix Aitoff projection
    double X0 = 50, Y0 = 50;
    double scaleX = 312, scaleY = scaleX/2; // <<<< this is the proper scaling missing
    TGraph* g = new TGraph();
            g->SetPoint(0, 100/scaleX, 60/scaleY);

    TCanvas *c1 = new TCanvas("c1", "Skymap Projections", 600, 600);
   
    c1->SetGridx(1);
    c1->SetGridy(1);
    hProj->Draw("AITOFF");
    g->SetMarkerStyle(3);
    g->SetMarkerColor(kRed);
    g->SetMarkerSize(4);
    g->Draw("P SAME");
    c1->cd(2)->Update();
}

Are you looking for something like this:

?

see this issue.