I am observing a strange behavior when switching a canvas to logx (graphically from TCanvas).
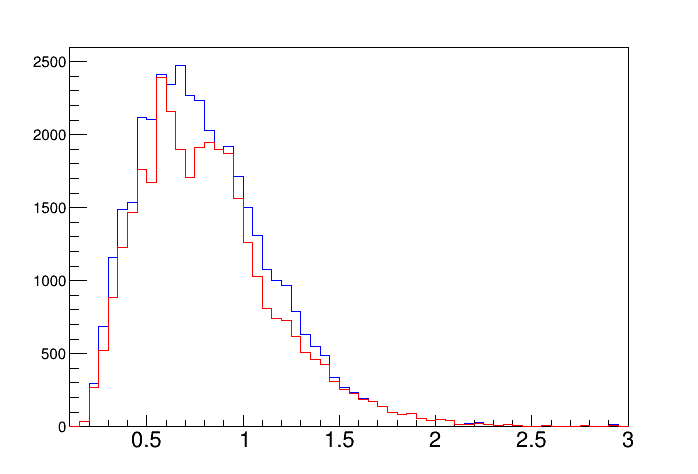
I am plotting two histos(with same nbins and ends) together. When I plot with linear scale, they look correct (see picture). The beginning/end of each bin appears in the same place for both histos, and the red one is never over the blue one as it should.
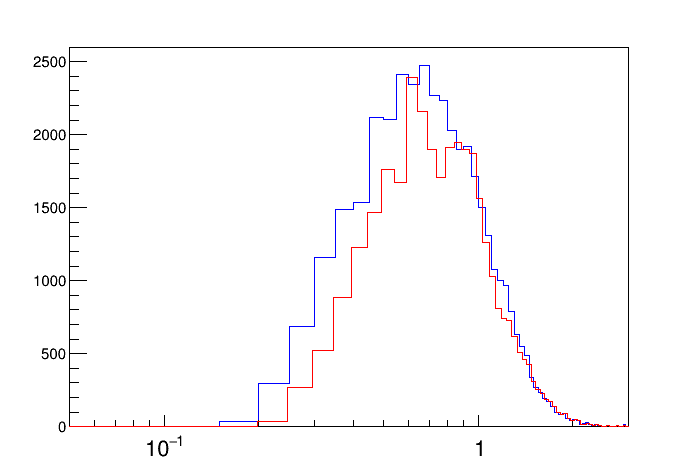
Switching to log, it looks like the red histo is higher than the blue one in some bins (meaning it’s not at the same values). Moreover, it looks the beginning and end of bins are not matching across the two histos.
Any idea why, and how to ensure consistency when setting log scale?
Please read tips for efficient and successful posting and posting code
ROOT Version: Not Provided
Platform: Not Provided
Compiler: Not Provided