Hi,
I created a program in Python that makes a ROOT.TH2D histogram and save it into a Canvas.
My next step is to configure an algorithm that, for each row where my mouse cursor is being displayed, highlight that row and display simultaneously other canvas with the TH1D histogram associated, as shown in the Highlight mode for histogram example here:
https://root.cern/doc/master/classTHistPainter.html#HP30
More graphically, my intentions can be better understood with this image:
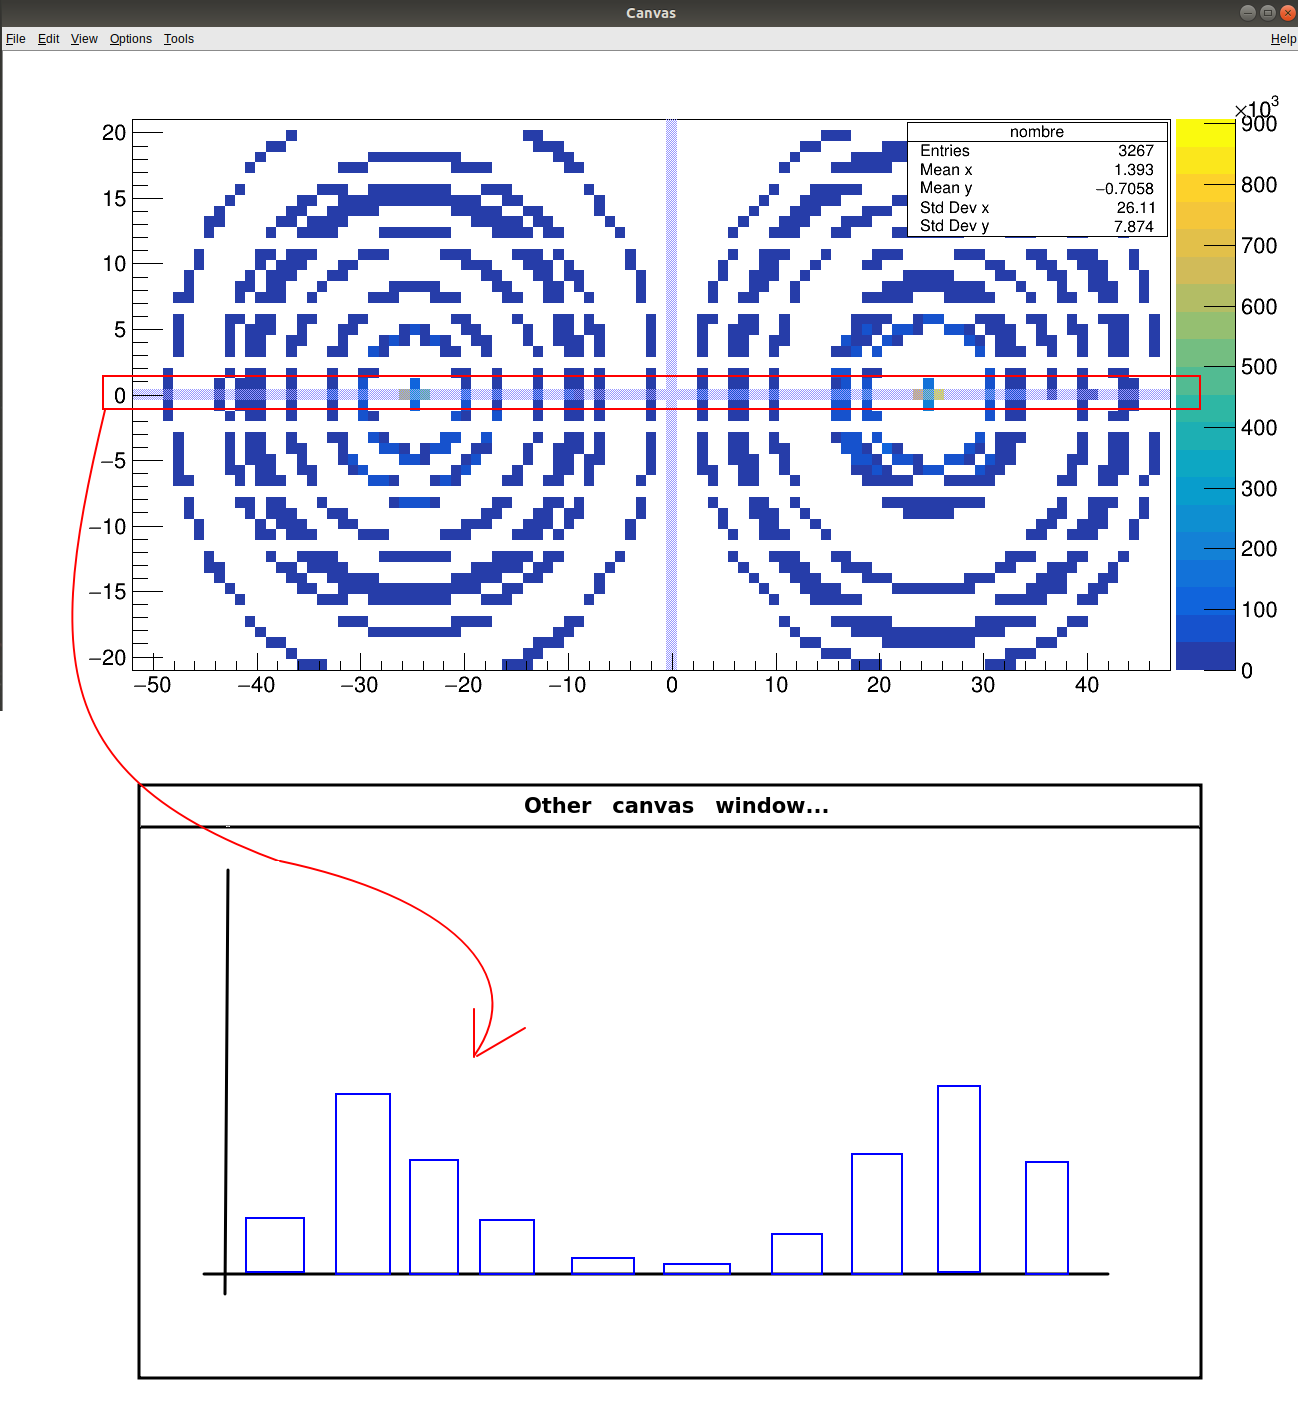
and, if I move my cursor to other row, the canvas with the TH1D change too.
How can I do this?
Sorry if this is a duplicate question, but the most similar posts I found were about GUI issues with no special focus in this behaviour…
Thanks in advance!