Dear Root experts,
I have a quite interesting problem and don’t know how to approach it.
I create a vector of TH1D* and fill the histogram with data.
I would like to plot them on the same canvas with different colors in order to compare.
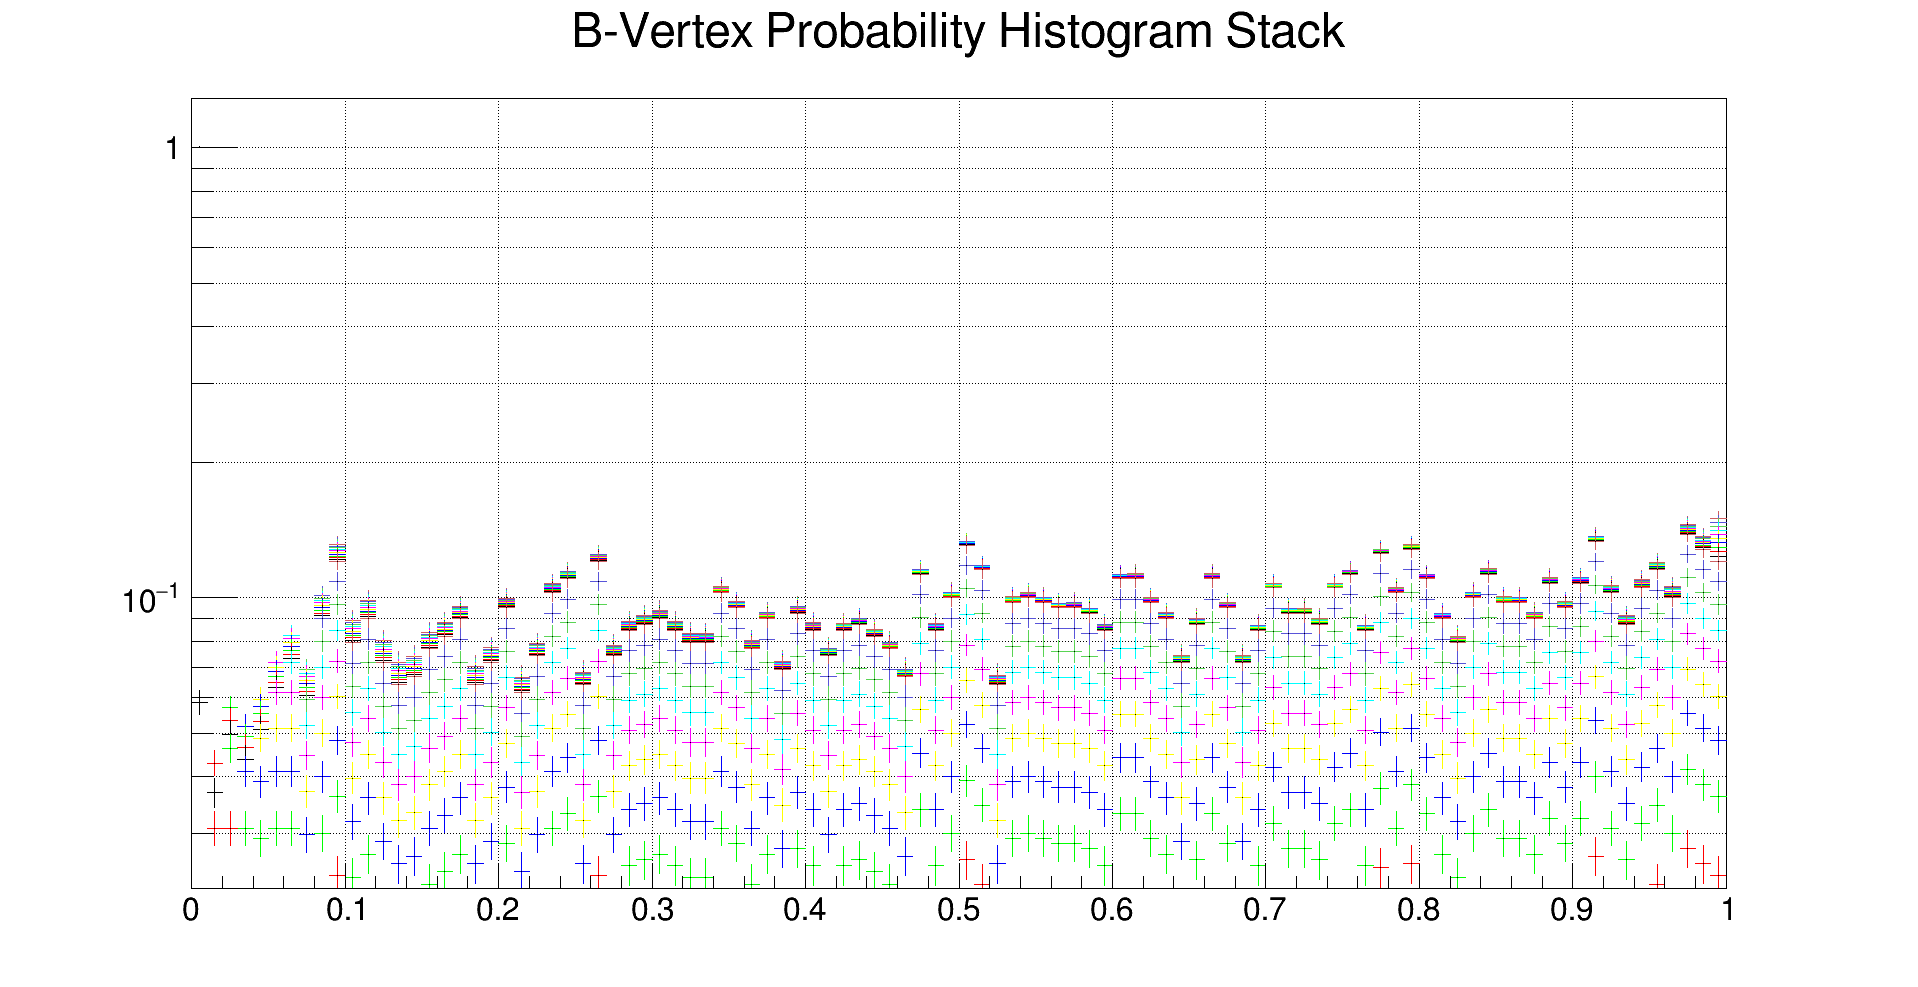
When plotting I only see colorful crosses in the plot and not filled histograms.
I noticed if I define/declare and fill the histograms separately (not making vector of TH1D*), everything will be plotted fine. I will have histograms with histograms filled and with different colors.
So I know the problem is storing the histograms in a vector. But I need to do so since the number of histograms is large and working with separate histograms (compared to a vector if THD1*) makes the code extremely long.
Here is my code (part of it) an example when I use a vector:
BVertexProbability.cc (6.9 KB)
Thank you for the help