Hello members,
I’m trying to set custom label text to my plot without succeding.
I have two variables containing UNIX timestamp (both x and y axis) like the following:
1571512509.75453281 1571512436.3672754765
1573067132.46653271 1573067032.4487934113
1574187938.58653259 1574187821.0598139763
1574188876 1574188759
1574187990.64778 1574187873.21444
1574188108.857 1574187992.286
1574227092 1574226973
1574879800 1574879672
1574919133.64829254 1574919003.3851053715
1575570364 1575570225
1577729741.86 1577729572.61571
1577729751.87293243 1577729580.9532108307
1577768415.5756619 1577768243.3233244419
1579023079.08765864 1579022886.0400290489
1582332643.676 1582332403.324
1582332895.6625 1582332655.47375
1583174670.8675 1583174419.8725
1583191877.273 1583191625.779
1583192008.55 1583191757.01375
1585691125.61286 1585690840.20429
1590429299.62875 1590428955.8925
1595405411 1595405000.82714
1595879472.51889 1595879056.36333
1597949150.65 1597948704.67778
1598384425.35857 1598383972.60429
1600108253.295 1600107774.02167
1609827261.64571 1609826672.18714
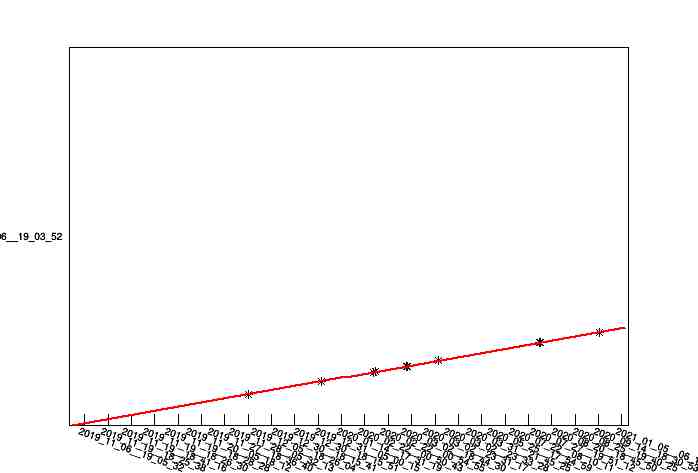
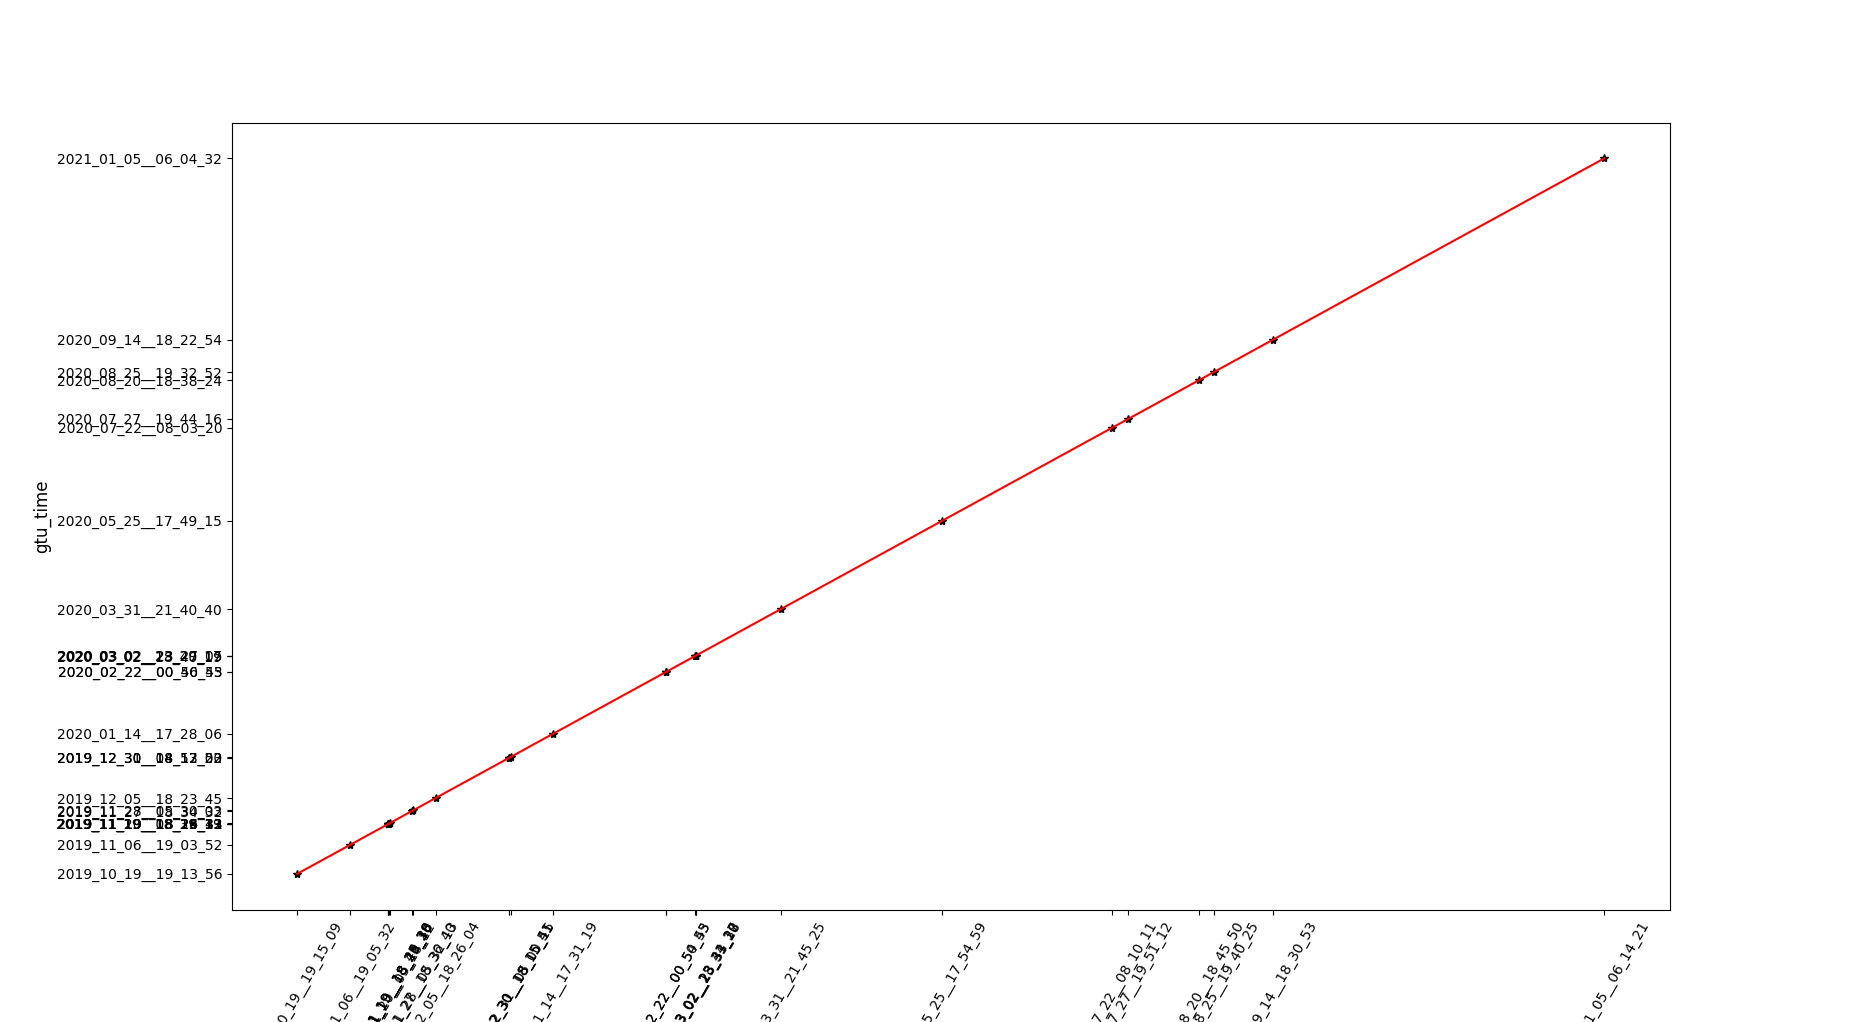
I made a plot and i fit those points with pol1 function.
I’m using PyROOT and I was able to change Unix timestamp
in a human readable way such that : 2019_10_19__19_15_09
Now I would like to change the axis labels (both in x and y) with
those new formatted times.
The code is showed below:
import numpy as np
import ROOT
from ROOT import TChain, TSelector, TTree, TCanvas, TFile, TProfile, TGraph, TCanvas, TH1F, TH2F, TMultiGraph, TLegend, TH2D, gROOT
import time, sys, datetime


y = []
x = []

x_time = []
y_time = []
run = []

g_gtu = ROOT.TGraph()

r1=1560000000
with open("file") as f:
	for line in f:
		if "#" in line: continue
		vals = line.split()
		print vals[3], vals[7]
		x.append(float(vals[3]))
		y.append(float(vals[7]))
		run.append(int(vals[1]))
		loc_time_euso = time.gmtime(float(vals[3]))
		loc_time_true = time.gmtime(float(vals[7]))
		t_conv_euso = time.strftime("%Y-%m-%d, %H:%M:%S", loc_time_euso)
		t_conv_true = time.strftime("%Y-%m-%d, %H:%M:%S", loc_time_true)
		x_time.append(t_conv_euso)
		y_time.append(t_conv_true)
		g_gtu.SetPoint(g_gtu.GetN(), float(vals[3]), float(vals[7]))

print x_time, y_time
x = np.array(x)
y = np.array(y)
run = np.array(run)
#print x, type(x), y, type(y)

c1 = ROOT.TCanvas()
xaxis = g_gtu.GetXaxis()
yaxis = g_gtu.GetYaxis()
for h in range(len(x)):
	xaxis.SetBinLabel(h,x_time[h])
	yaxis.SetBinLabel(h,y_time[h])
#xaxis.SetLimits(0.,1700000000)
g_gtu.Draw("A*")
f = ROOT.TF1("f", "pol1", 1571512400-100000, 1575570364+100000)
#f = ROOT.TF1("f", "pol3", 1571512400-100000, 1575570364+100000)
#f = ROOT.TF1("f", "pol1")
fit_res = g_gtu.Fit(f, "SN")
print fit_res.GetParams()[0], fit_res.GetParams()[1]
The resulting plot is the following:
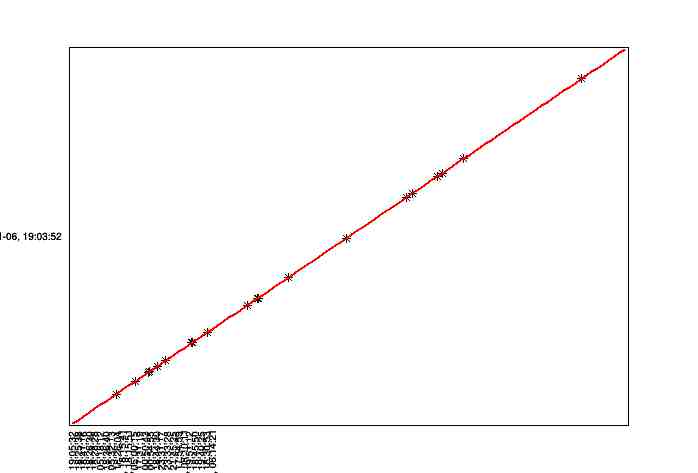
Can someone help me to understand what’s happening? Probably it is a rebinning problem and I tried several way, also with a TH2F histogram but the issue remain.
Moreover, I would like to set also the label angle…i know there is the SetTextAngle method but I don’t know how to use it.
Could you please help me with the code or at least suggest me the right documentation?
Thank you in advance!
_ROOT Version: 5.34/36
Platform: Not Provided
Compiler: Not Provided