I just started using ROOT and even though I spent several days reading, I do not understand why my simple code is not working…
I have a test file containing many columns of data, which I import using ifstream and select three of them to plot using TGraph2D. The data is imported and the numbers are correct. I used two methods (plot.cxx and plot3.cxx, which as expected gives the same result as plot2.cxx) to set the points.
The first one (plot.cxx) just spits out the error:
Two of these three points are coincident blah blah
and causes ROOT to go into an infinite loop (it just keeps printing the same error about the same data point over and over and I have to kill ROOT).
The second one does not give any error, but the graph is empty (like all z-values are 0), even though the axis ranges are set automatically to the correct values (min and max values in my data).
I do not understand where I’m going wrong.
P.S. I tried importing the data using TTree as was done in the tree/basic.C tutorial, but this gives the following error for every single line of the data:
Couldn't read formatted data in....
Even if I run the tutorial itself (basic.C) it gives the same thing instead of do what it’s supposed to! Am I supposed to set some env variable to make this work?? plot3.cxx (948 Bytes) plot2.cxx (1019 Bytes) plot.cxx (665 Bytes)
Hello, I looked at quickly your codes and in plot.cxx, did you try to put “i++” just after
Normally, pl is expecting to have a point at “0”.
For plot2 and plot3, did you try to use directly the vector to “construct” your TGraph2D ; something like that
Normally, it is exactly the same as what you did with the arrays.
Finally, I guess, you have check that your vector does not contain only empty values.
EDIT : I modified a little bit your plot2.cxx and I got a running example
[code]#include
using namespace std;
int test()
{
TCanvas *c_pl = new TCanvas(“c_pl”);
vector < float > v_xt, v_mst1, v_mh1;
const unsigned int n = v_xt.size();
Float_t a_xt[n], a_mst1[n], a_mh1[n];
for (Int_t i = 0 ; i < n ; i++)
{
a_xt[i] = v_xt.at(i);
a_mst1[i] = v_mst1.at(i);
a_mh1[i] = v_mh1.at(i);
}
TGraph2D * pl = new TGraph2D(n, a_xt, a_mst1, a_mh1);
pl->Draw(“SURF1”);
return 0;
}[/code]
You can run it doing “.x test.C”
[quote=“pamputt”]Hello, I looked at quickly your codes and in plot.cxx, did you try to put “i++” just after
pl->SetPoint(i,xt,mst1,mh1);
Normally, pl is expecting to have a point at “0”.
[/quote]
Hi and thanks for replying! I didn’t know that, I thought its point numbers start at 1, that’s why I had done it like that. Using your suggestion does indeed fix the issue with the errors and the loop and now all three .cxx files give the same (flat) graph.
I tried that now - same result.
I had done that in the beginning while debugging and none of them are zero - all three coordinates lie in the ranges they should (I outputted all of them)…
I exported my data (not using ROOT), this time selecting only these three columns and these ranges, so that I can attach the file (otherwise it’s HUGE). So there they are, but still it gives just a flat graph…
Edit:
I had made a mistake in plots.cxx (recalculating xt from values I wasn’t even importing). I fixed it (the file is now updated), but still flat graph. plot_selected.cxx (368 Bytes) data_selected.dat (69.3 KB)
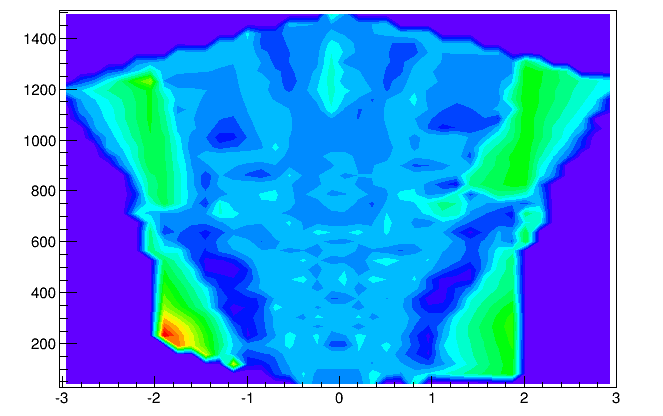
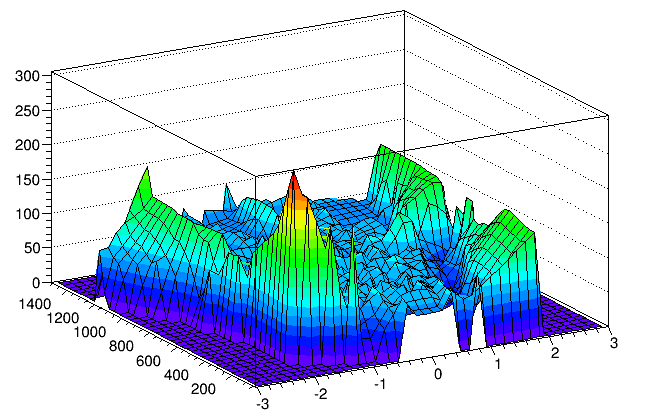
Hmm, I do not know really TGraph2D and its Draw option. Anyway, I got also a flat graph with the “surf” option. But if I use “p” option (instead of surf), I got something consistent with your data. Same result with other options shown here
So you have to investigate this “surf” option. I have no idea
Tips : to fill your TGraph2D, you can skip the “ifstream step” by doing simply
{
  TGraph2D * pl = new TGraph2D("data_selected.dat","%lf%lf%lf");
  pl->Draw("pcol");
}
[quote=“pamputt”]Hmm, I do not know really TGraph2D and its Draw option. Anyway, I got also a flat graph with the “surf” option. But if I use “p” option (instead of surf), I got something consistent with your data. Same result with other options shown here
So you have to investigate this “surf” option. I have no idea
[/quote]
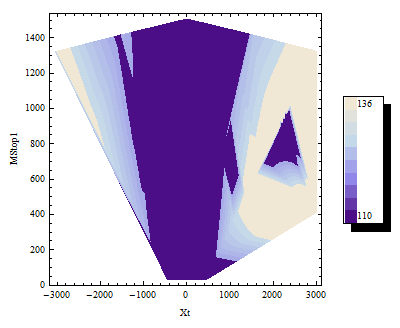
True, this way I get my plot, but not really in the form I need it I need it to be of the form plt1xth1.png (this is actually the same data but plotted in Mathematica and in the full range). I saw [url=https://root-forum.cern.ch/t/tgraph2d-and-contour-plots/14372/1 topic and thought that the option COL, CONT4 or CONT5 used there would work, but they all give a blank 2D surface…
[quote=“pamputt”]
Tips : to fill your TGraph2D, you can skip the “ifstream step” by doing simply
{
  TGraph2D * pl = new TGraph2D("data_selected.dat","%lf%lf%lf");
  pl->Draw("pcol");
}
[/quote]
Thanks for the tip! Can I make this work with my full data set (18 columns) and choose two of them as y and z and calculate x from other columns?
I figured out what was wrong! My z function wasn’t single-valued (it had a small dependency on other parameters as well, which were not plotted). Mathematica didn’t have a problem, because it simply took the first point with coordinates x and y and ignored all subsequent points with the same x and y coordinates. However ROOT ignored ALL points which were ambiguous (when drawing surface or contours). I edited my data to remove such points and I got my plots! Thanks for the help again!


 I need it to be of the form plt1xth1.png (this is actually the same data but plotted in Mathematica and in the full range). I saw [url=https://root-forum.cern.ch/t/tgraph2d-and-contour-plots/14372/1 topic and thought that the option COL, CONT4 or CONT5 used there would work, but they all give a blank 2D surface…