for (int i=1;i<8001;i++) isto->Fill(-999.5+(i-1)*binsize,N[i-1]);
(The macro prints the right values for N[i] and even fits ignore these lines so I think this is a graphical problem but maybe I am a disaster with C++ )
Thanks a lot
Can you provide which version of ROOT, on which platform, which compiler, and how you actually plot the data? And I don’t think that XMing is relevant here (and this is definitively not a GUI problem, but rather a graphic one - @couet ?)
Root 6.08/04 on WLS (Linux 16.06.7on Windows 10, gcc 5.4.0) (I know it is a bit old but only this version outlived other problems)
I used something like this (filling vectors from a .dat)
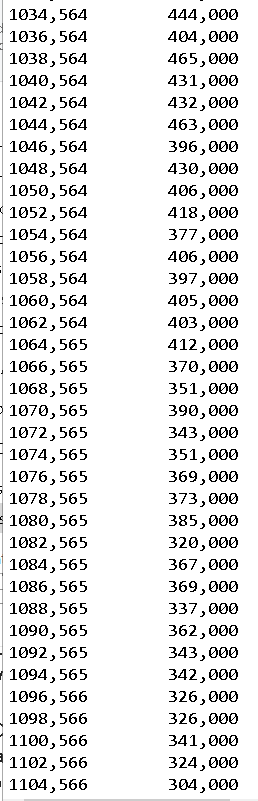
vector <double> N ;
	vector <double> bin ;
TH1D* isto= 	new TH1D ("isto","isto",8000,-999.5,14999);
   double binsize=(14999+999.5)/8000;
  for (int i=1;i<8001;i++) isto->Fill(-999.5+(i-1)*binsize,N[i-1]);
isto->Draw("hist");
I don’t know if you needed to know this or something different
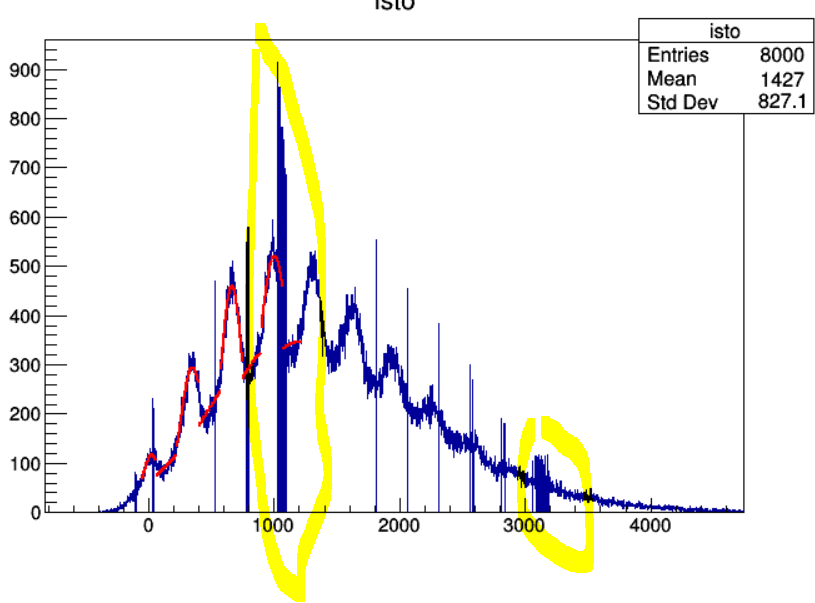
It is a binning issue…Some “Fill” fall in unexpected bins. That’s why you see some empty bins next to doubly filled ones. Check the formula -999.5+(i-1)*binsize it might be wrong.
Ok it’s a binning issue. The formula is right I think because I tried to fill the bins “step by step” and now everything seems right.
 for (int i=1;i<201;i++) isto->Fill(-999.5+(i-1)*binsize,N[i-1]);
    for (int i=201;i<1001;i++) isto->Fill(-599.487+(i-1-200)*binsize,N[i-1]);
  for (int i=1001;i<8001;i++) isto->Fill(1000.563+(i-1-1000)*binsize,N[i-1]);
Maybe there are smarter solutions but I got my histogram.
Thanks a lot @bellenot and @couet
 )
)