Arouca
November 17, 2016, 3:18pm
1
Dear Rooters:
[code]TCanvas *c1 = new TCanvas(“c1”);data=(TTree )ficheiro->Get(“data”);
TH3F htemp=(TH3F )gPad->GetPrimitive(“htemp”);
TAxis *axisZ = htemp->GetZaxis();
g->Draw(“line SAME”);[/code]
The problem is: I want to draw the grid lines in all the axis. I have already tried with:
c1->SetGrid():or
gPad->SetGrid(); but not of the methods have success.
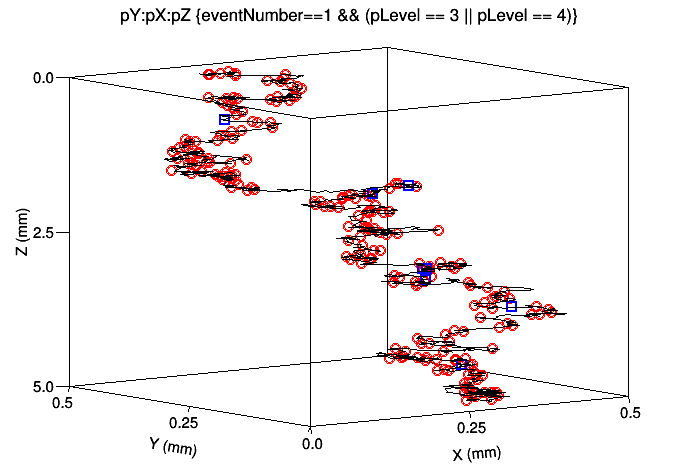
Picture obtained:
Carlos
couet
November 17, 2016, 3:22pm
2
I do not understand your problem because the grid lines are drawn by default on TGraph2D.
root.cern/doc/master/classTGraph2D.html
Can you provide a running example showing your problem ?
Arouca
November 17, 2016, 3:30pm
3
[quote=“couet”]I do not understand your problem because the grid lines are drawn by default on TGraph2D.
root.cern/doc/master/classTGraph2D.html
Can you provide a running example showing your problem ?[/quote]
Dear Couet:
The code below (that is included in the file) is just a dirty way to get markers with thick lines (as far as i know it is not possible to change line width of markers, right?)
 data->Draw("pY:pX:pZ","eventNumber==1 && !(pLevel == 3 || pLevel == 4 || pLevel==0)","SAME");
 data->SetMarkerSize(1.1);
 data->Draw("pY:pX:pZ","eventNumber==1 && !(pLevel == 3 || pLevel == 4 || pLevel==0)","SAME");
 data->SetMarkerSize(1.2);
 data->Draw("pY:pX:pZ","eventNumber==1 && !(pLevel == 3 || pLevel == 4 || pLevel==0)","SAME");
Carlosoutput.root (256 KB)Level0ROOT.dat (53.4 KB)DrawExcitationsFromFile.C (2.27 KB)
couet
November 17, 2016, 4:36pm
4
void DrawExcitationsFromFile()
{
   TCanvas *c1 = new TCanvas("c1");

   TGraph2D *g = new TGraph2D("Level0ROOT.dat","%lg %lg %lg",",");

   TFile *ficheiro= new TFile("output.root","READ");
   TTree *data=(TTree*)ficheiro->Get("data");

   data->SetMarkerStyle(4);
   data->SetMarkerColor(kRed);
   Double_t size=data->GetMarkerSize();
   cout<<size<<endl;
   g->Draw("line ");

   data->Draw("pY:pX:pZ","eventNumber==1 && (pLevel == 3 || pLevel == 4)","SAME");
  }
Arouca
November 17, 2016, 4:52pm
5
Thank you.
Carlos