Hi,
I am trying to develop an application to create a 3D map of optical transmittance as a function of position (example attached). Where would be a good place to start?
Thanks

Root Version: 6.18/00
Platform: OsX 10.14.5
May be many 3D polyline
Do you happen to know the name of this diagram? I’m trying to find existing documentation on it.
I am not sure this kind of diagram has a name.
If it has one I do not know it.
Hi,
how did you generate this plot (with ROOT?) ,
if so: can you provide the macro
or did you find it somewhere?
Can you provide the URL of the source
Cheers
Otto
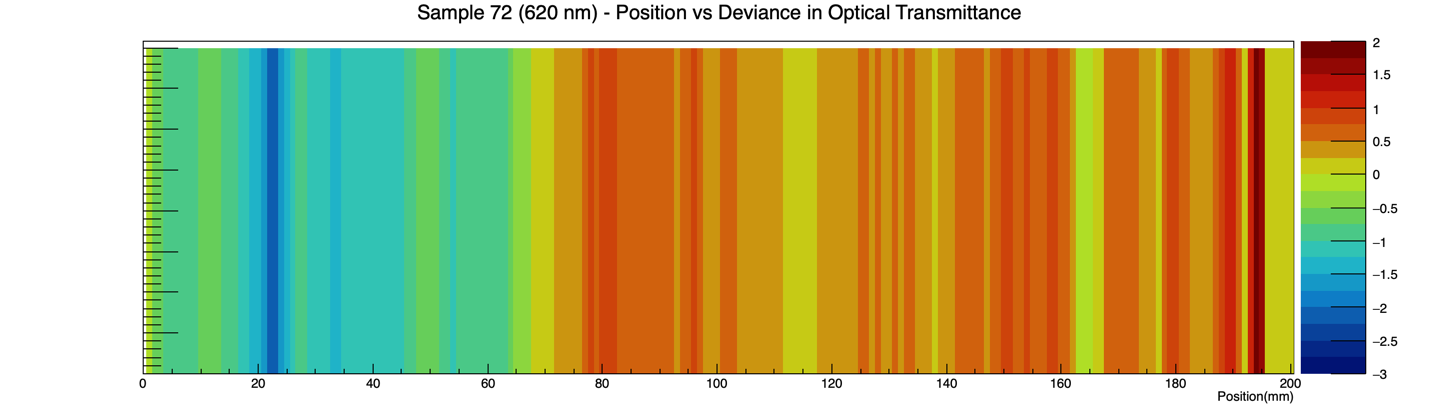
Someone else made this plot with MatLab, but our lab lost the code. However, I replicated producing one face in ROOT with the TH2 Poly class. I’ll enclose the macro and photo.
#include <fstream>
#include <iostream>
#include <stdio.h>
#include <fstream>


void Crystal72_2D_2(){

  struct input_t

  //Define array  structure for input

  {
    Double_t transmittance;
  };

  input_t input;

  // Reads data from ONE column of data

  FILE *f = fopen("Crystal72_2.txt","r");
  char line[400];

  // Creates array

  Double_t transArray[196];


  Int_t j=0;
  TFile *file = new TFile("test.root","RECREATE");
  for(Int_t i;fgets(&line[0],500,f);i++){
    if (line[0] == '#'){
      continue;
    }else{
      sscanf(&line[0], "%lf", &input.transmittance);
    }

      transArray[j]=input.transmittance;
      j++;

   }


  //Finds the average
  float avg = 0.0;
  float sum = 0.0;
  int size;

  size = sizeof(transArray) / sizeof(transArray[j]);

  for (int i = 0; i < size; ++i)
   {
   sum += transArray[i];
  }
  avg = ((float)sum)/size; //or cast sum to double before division

  //cout << "Average  " << avg << "\n";

  // Calcuates deviance

  Double_t dev[size];

  for(int i = 0; i < size; i ++)
  {
      dev[i]= transArray[i] - avg;
      //cout << "Deviance  " << dev[i] << "\n";
  }


  //Set-up canvas/graph

  TCanvas *ch2p2 = new TCanvas("ch2p2","ch2p2",1000,300);
  gStyle->SetPalette(kRainBow);
  TH2Poly *h2p = new TH2Poly();
  h2p->SetName("Boxes");
  h2p->SetTitle("Boxes");
  Int_t i,l;
  Int_t nx = 200;
  Int_t ny = 1;
  Double_t xval1,yval1,xval2,yval2;
  Double_t dx=1, dy=4;
  xval1 = .5;
  xval2 = dx + xval1;
  yval1 = -4;
  yval2 = dy;

  // In the x, there is a bin per mm.
  // In the y, there is only one bin. In this sense, "y" is meaningless.
  // Optical transmittance is reflected in the z.


  // This "for" loop adds "nx" bins in increments of "dx".
  for (i = 0; i<nx; i++) {
     h2p->AddBin(xval1, yval1, xval2, yval2);
     xval1 = xval2;
     xval2 = xval2+(dx);

     //Since y is meaningless, the weight is used to create the different shades of color

     h2p->Fill(i, 1 , dev[i]);
  }

  // Sets the range and removes the y-axis.

  h2p->GetXaxis()->SetRangeUser(0,200);
  h2p->GetYaxis()->SetRangeUser(0,100);
  h2p->GetZaxis()->SetRangeUser(-3,2);
  h2p->GetYaxis()->SetLabelOffset(999);
  h2p->GetYaxis()->SetLabelSize(0);


  // Sets the title, removes the stats box, and draws graph.
  h2p->SetTitle("Sample 72 (620 nm) - Position vs Deviance in Optical Transmittance; Position(mm); TEST; TEST; TEST");
  h2p->SetStats(0);
  h2p->Draw("COLZ");

  return ch2p2;
}
Does anyone know how to label the weight (the colored bar on the right)? I tried doing this:
h2p->GetZaxis->SetTitle(Optical Transmittance Deviance (%));
However, I get “error: reference to non-static member function must be called; did you mean to call it with no arguments?”
  // Sets the title, removes the stats box, and draws graph.
  h2p->SetTitle("Sample 72 (620 nm) - Position vs Deviance in Optical Transmittance; Position(mm); Y Axis; Z Axis");
  h2p->GetZaxis()->SetTitleOffset(0.5);
  h2p->SetStats(0);
  h2p->Draw("COLZ");