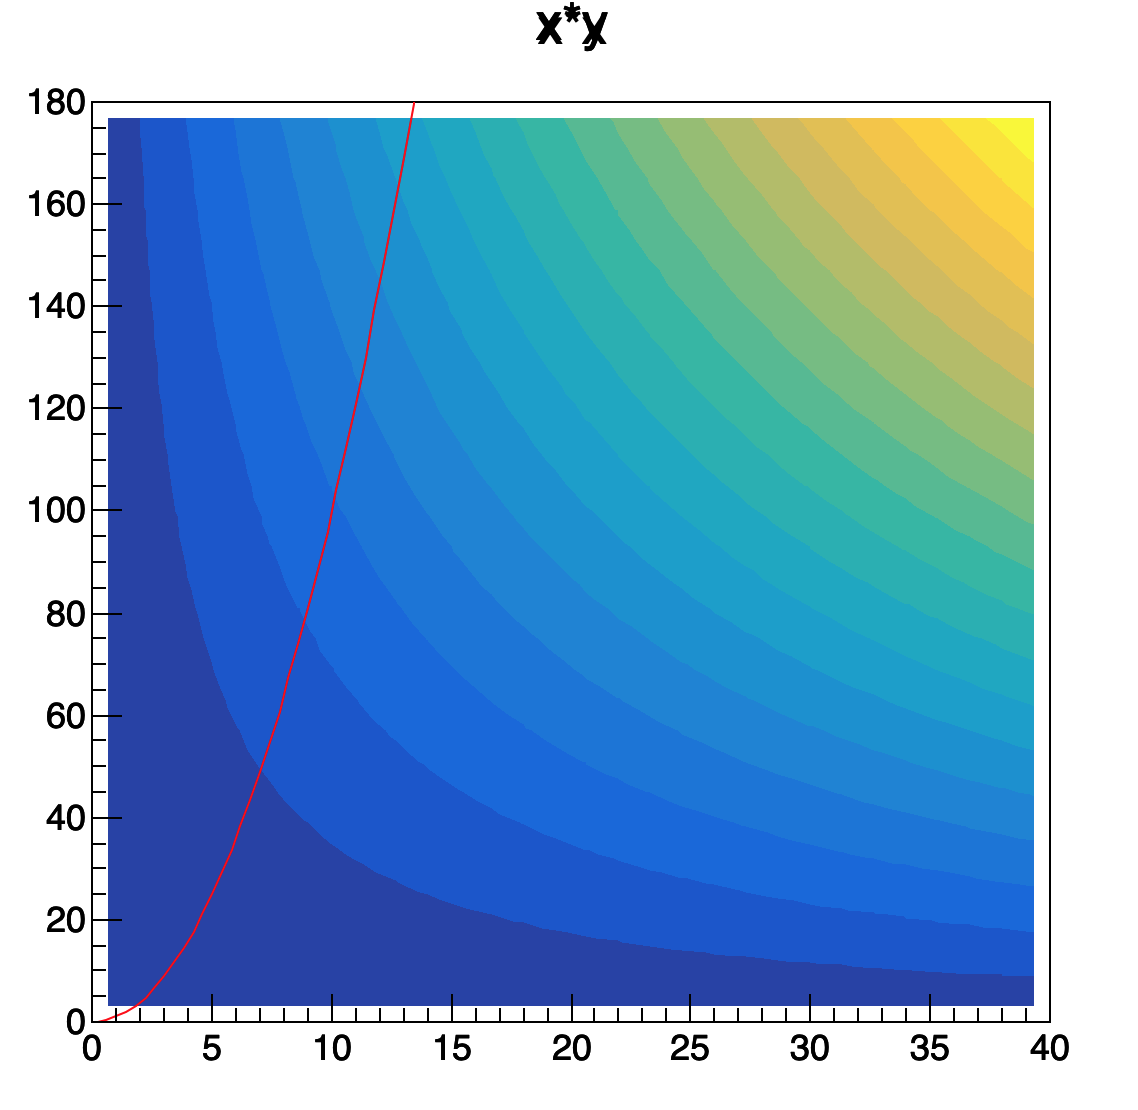
I have a surface color contour plot made using a TF2 object, but above a certain line of y = f(x), the x and y variables represent unphysical situations and I basically want to not show anything in these areas or in some way show that they’re excluded. I tried having the function I used in the TF2 constructor only return a value if the constraints are satisfied, but that did nothing.
The idea I had was to superimpose a TF1 object representing the constraint line as y = f(x) and then fill the area above the curve to be excluded, but I’m running into a lot of difficulty here and I have a feeling this isn’t the most intelligent way to go about this.
I hope this question isn’t too open ended for here, but I’m just looking for any help or suggestions to go about this.
Thanks
ROOT Version: Not Provided Platform: Not Provided Compiler: Not Provided
Thanks for the response, here’s a macro for what I’m trying to do with the transparent pad. I haven’t tried shading the area above the curve yet, but I would just like to know if there’s any better method.
I want to mark the area above the curve as excluded in some way. I think could define another TF1 on the transparent pad which intersects with this one off the graph area & shade between them, but in the actual application I’m running into difficulty even reproducing a plot like that shown and I’m wondering if you know a better way to do that, perhaps within the scope of the TF2 itself.