Graphical and variable cuts in TTree->Draw()

I currently have a TTree that contains events, and I would like to draw a histogram with variable and graphical cuts. I am drawing this in the terminal with

tree->Draw("z>>a(401,-50,-10)","cut0 && theta > 11")

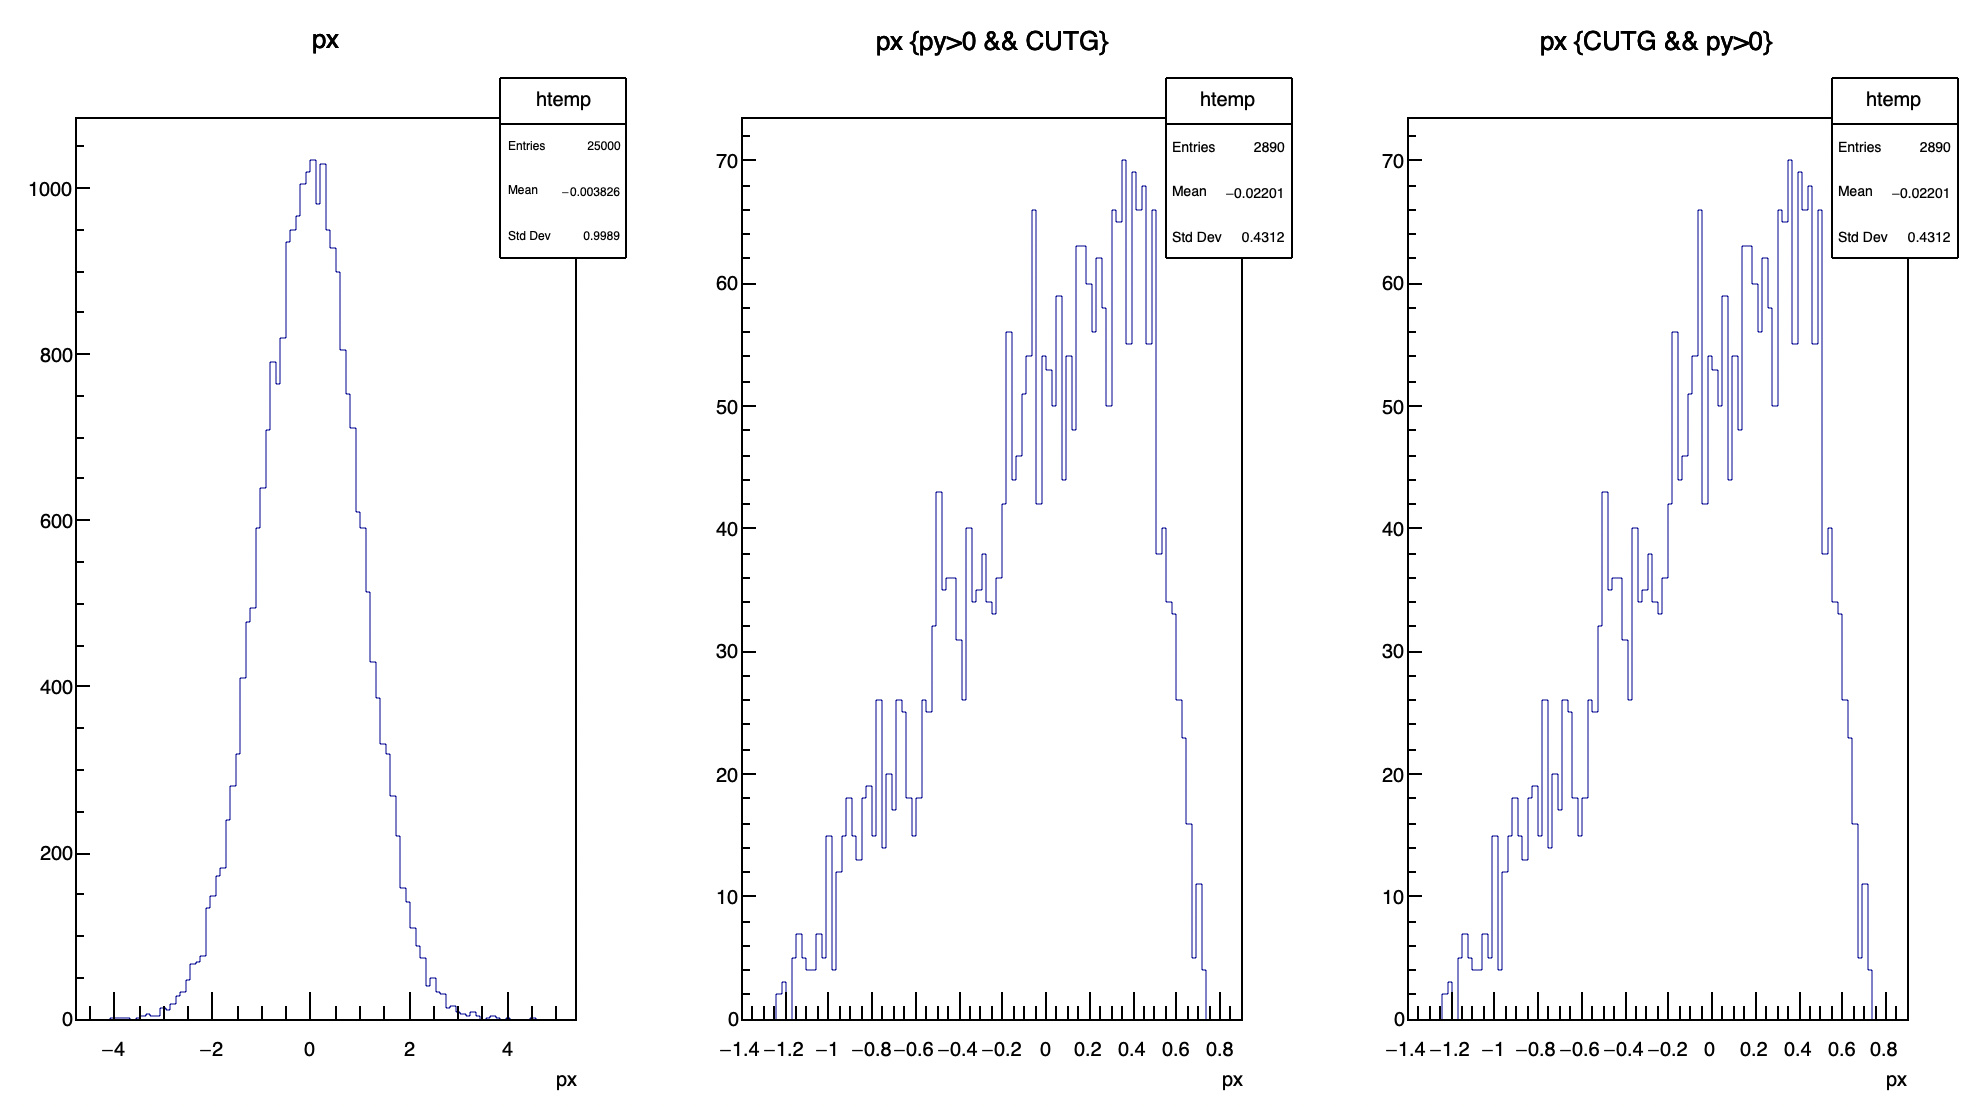
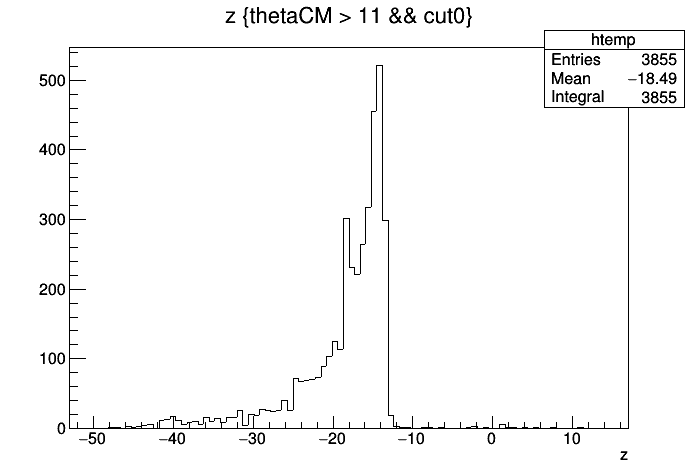
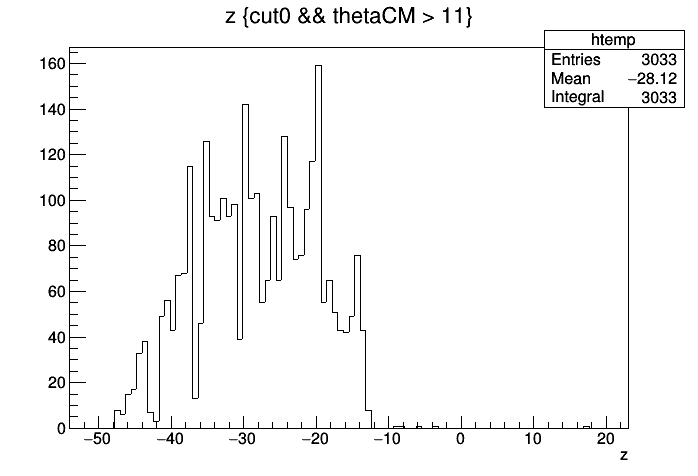
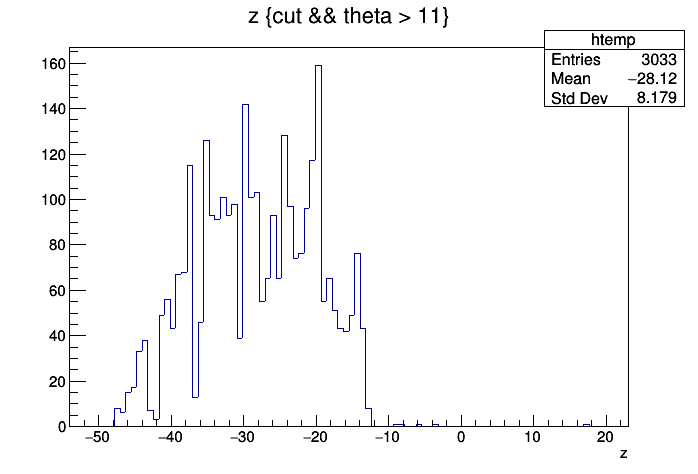
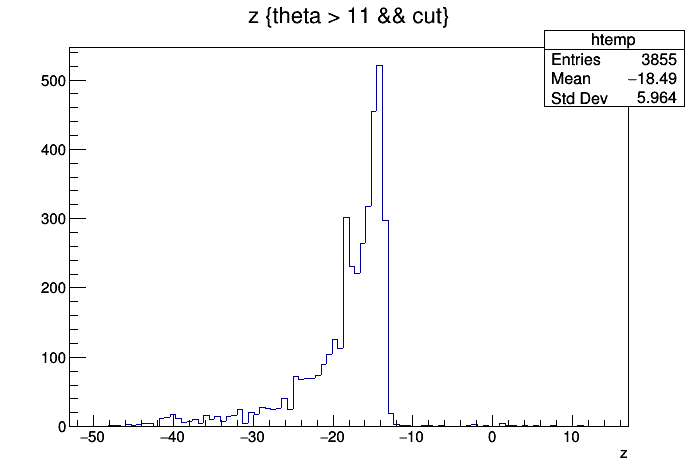
where cut0 is a pre-defined graphical cut stored in the same TFile as the TTree, and theta is a branch in my TTree. I have noticed that swapping the order of the cuts,

tree->Draw("z>>a(401,-50,-10)","theta > 11 && cut0")

changes the number of counts I get in my final histogram, as well as the overall shape. I would have thought that applying the cuts in a particular order would not matter. Is there a difference between these two options?


_ROOT Version: _6.14
Platform: CentOS 7


@pcanal you might be able to help here? Thanks!

Never tried TCut in a string-like way, thought you need to do sth like cut0 && “theta > 11”
But in this case, does the bracket around cut0 matters?

The command

tree->Draw("z>>hist(400,-50,-10)", cut0 && "theta > 11")

does not seem to work (ROOT spits out a load of errors that says I’m misusing the function Draw()). cut0 itself is a TCutG*. This code also does not work when it is cast to a TCut*.

I tried to reproduce your issue using the ntuple produced by the standard example hsimple.C. My example is:

{
   auto c = new TCanvas("c", "c", 1000, 600);
   c->Divide(3,1);

   TCutG *cutg = new TCutG("CUTG",3);
   cutg->SetVarX("py");
   cutg->SetVarY("px");

   cutg->SetPoint(0,0.01181948,-1.2875);
   cutg->SetPoint(1,0.9815545,0.7625);
   cutg->SetPoint(2,-1.059993,0.1375);

   c->cd(1); ntuple->Draw("px");
   c->cd(2); ntuple->Draw("px","py>0 && CUTG");
   c->cd(3); ntuple->Draw("px","CUTG && py>0");
}

It gives this plot:

As you can the two last plots are the same despite the fact I changed the cuts order.
The first plot is the data set without cut.

Can you also try without defining the histogram ?

Thanks for the feedback - unfortunately I have been unable to fix the issue.

Following @couet’s post, I tried again without the histogram defined in the commands. The commands I used were:

tree->Draw("z","cut0 && theta > 11")

and

tree->Draw("z","theta > 11 && cut0")

which gave me the following plots

which are clearly different. Could it be a problem in the way one of the quantities is defined? I also have noticed that the cut is not a part of the tree - could that be a potential cause?

Can you post the ROOT file and macro needed to reproduce this behavior ?

I have been using terminal commands, so there is no macro at the moment. The commands I have been using are listed above. The file is too big to share here, but here is a link.

I can reproduce the problem with the following macro:

{
   auto f = new TFile("ptmac.root");
   auto C = new TCanvas();
   C->Divide(2,1);
   TCutG *cutg = new TCutG("CUTG",4);
   cutg->SetVarX("z");
   cutg->SetVarY("theta");
   cutg->SetPoint(0,-30,2);
   cutg->SetPoint(1,-10,5);
   cutg->SetPoint(2,-5,40);
   cutg->SetPoint(3,-50,25);

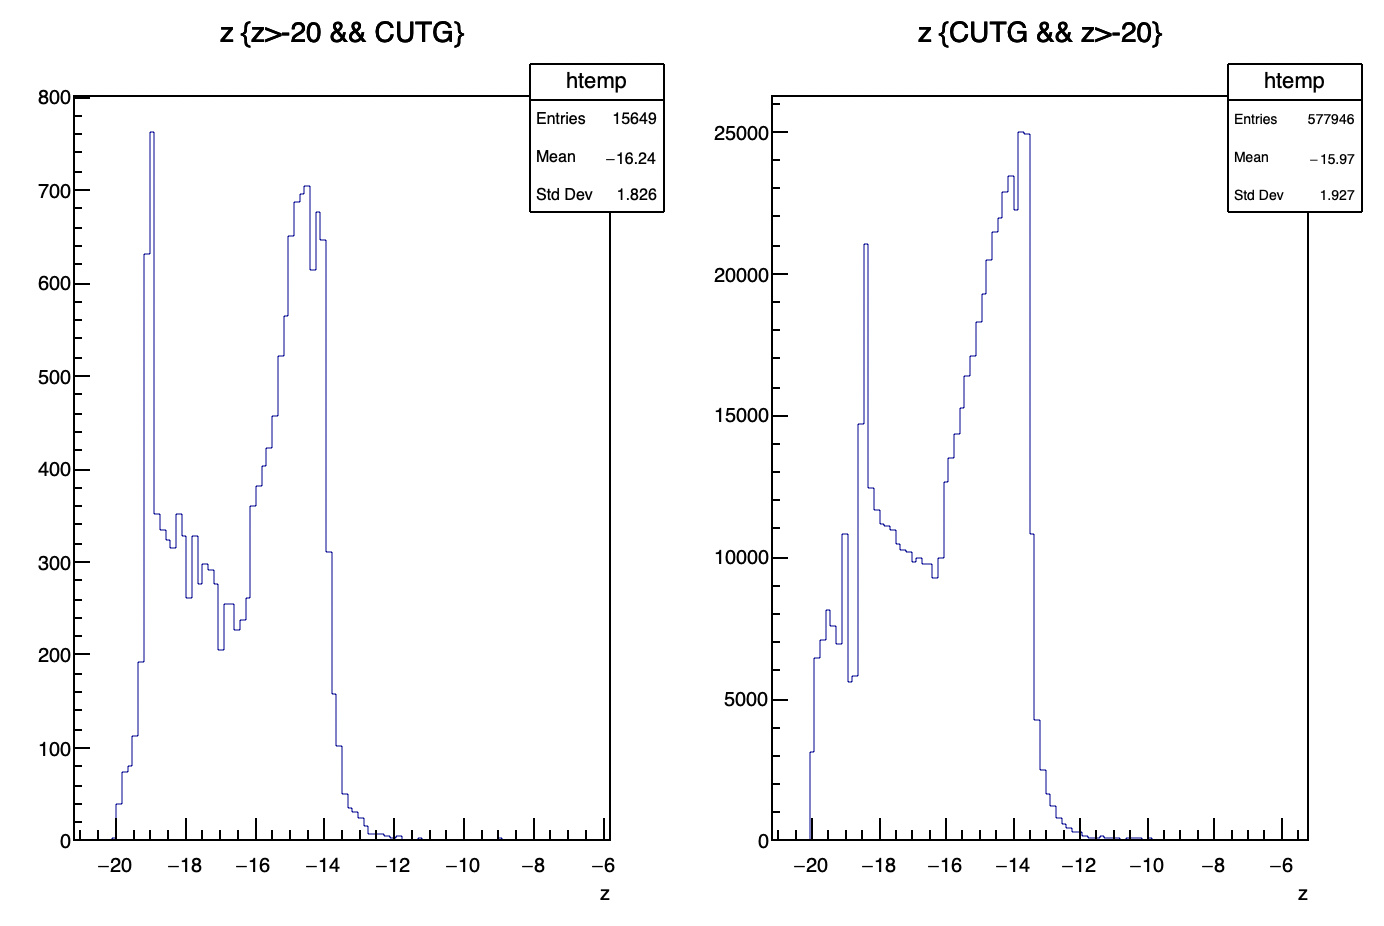
   C->cd(1); tree->Draw("z","z>-20 && CUTG");
   C->cd(2); tree->Draw("z","CUTG && z>-20");
}

do you know your tree is full of NaN ?

root [3] tree->Scan("z:theta")
***********************************************
*    Row   * Instance *         z *     theta *
***********************************************
*        0 *        0 *       nan *       nan *
*        0 *        1 *       nan *       nan *
*        0 *        2 *       nan *       nan *
*        0 *        3 *       nan *       nan *
*        0 *        4 *       nan *       nan *
*        0 *        5 *       nan *       nan *
*        0 *        6 * -45.69178 *       nan *
*        0 *        7 *       nan *       nan *
*        0 *        8 *       nan *       nan *
*        0 *        9 *       nan *       nan *
*        0 *       10 *       nan *       nan *
*        0 *       11 *       nan *       nan *
*        0 *       12 *       nan *       nan *
*        0 *       13 *       nan *       nan *
*        0 *       14 *       nan *       nan *
*        0 *       15 *       nan *       nan *
*        0 *       16 *       nan *       nan *
*        0 *       17 *       nan *       nan *
*        0 *       18 *       nan *       nan *
*        0 *       19 *       nan *       nan *
*        0 *       20 *       nan *       nan *
*        0 *       21 *       nan *       nan *
*        0 *       22 *       nan *       nan *
*        0 *       23 *       nan *       nan *

The tree is full of NaN when there is no value recorded for a given event. This means that when a certain element of my experiment is triggered, values are not recorded on every element - do you think that this is the source of the problem?

I think it can a be a source of problems as we cannot do any meaningful computation on a NaN… and to apply cut we need to do computations …

However, I don’t want to do any computation on elements that are not being triggered in an event - if a NaN is not suitable for this, what would you recommend?

It is up to you to decide what could be a good value… 0 ?
Or something you consider as not meaningful and you can easily filter.

Actually, this is not the first time we meet it and I’m sure not the last one.
@Axel Maybe one could add “isnan”, “isfinite”, “isinf”, “isnormal” to functions which are recognized in cuts (actually in any TFormula, I think).

Note: “TMath::IsNaN” already exists so one should be able to use it right away in any cuts, e.g.:

   TCut AllKosher = "!TMath::IsNaN(z) && !TMath::IsNaN(theta)";
   C->cd(1); tree->Draw("z", AllKosher && "z>-20 && CUTG");
   C->cd(2); tree->Draw("z", AllKosher && "CUTG && z>-20");

Following @couet’s suggestion, I changed the value to -10000:

root [12] tree->Scan("z:theta")
***********************************************
*    Row   * Instance *         z *     theta *
***********************************************
*        0 *        0 *    -10000 *    -10000 *
*        0 *        1 *    -10000 *    -10000 *
*        0 *        2 *    -10000 *    -10000 *
*        0 *        3 *    -10000 *    -10000 *
*        0 *        4 *    -10000 *    -10000 *
*        0 *        5 *    -10000 *    -10000 *
*        0 *        6 * -45.69178 *    -10000 *
*        0 *        7 *    -10000 *    -10000 *
*        0 *        8 *    -10000 *    -10000 *
*        0 *        9 *    -10000 *    -10000 *
*        0 *       10 *    -10000 *    -10000 *
*        0 *       11 *    -10000 *    -10000 *
*        0 *       12 *    -10000 *    -10000 *
*        0 *       13 *    -10000 *    -10000 *
*        0 *       14 *    -10000 *    -10000 *
*        0 *       15 *    -10000 *    -10000 *
*        0 *       16 *    -10000 *    -10000 *
*        0 *       17 *    -10000 *    -10000 *
*        0 *       18 *    -10000 *    -10000 *
*        0 *       19 *    -10000 *    -10000 *
*        0 *       20 *    -10000 *    -10000 *
*        0 *       21 *    -10000 *    -10000 *
*        0 *       22 *    -10000 *    -10000 *
*        0 *       23 *    -10000 *    -10000 *
*        1 *        0 *    -10000 *    -10000 *
Type <CR> to continue or q to quit ==> 

which produces the same problem when using the cut in the output.root file and the condition theta > 11:

This avoids the issue with NaN’s, as there are no more in the tree. Here is a link to the latest root output file.

I managed to reduce the problem to something very small:

{
   auto file = new TFile("ptmac.root");

   TCutG *cutg = new TCutG("CUTG",4);
   cutg->SetVarX("z");
   cutg->SetVarY("theta");
   cutg->SetPoint(0,-30,2);
   cutg->SetPoint(1,-10,5);
   cutg->SetPoint(2,-5,40);
   cutg->SetPoint(3,-50,25);

   cout << "\n>>> z>-20" <<endl;
   tree->Scan("z:theta","z>-20","",15,3);
   cout << "\n>>> CUTG" <<endl;
   tree->Scan("z:theta","CUTG","",15,3);
   cout << "\n>>> z>-20 && CUTG" <<endl;
   tree->Scan("z:theta","z>-20 && CUTG","",15,3);
}

This macro gives the following output:

>>> z>-20
***********************************************
*    Row   * Instance *         z *     theta *
***********************************************
*        4 *       17 * -15.16831 * 27.436006 *
*       17 *       23 * -17.32491 * 26.818965 *
***********************************************
==> 2 selected entries

>>> CUTG
***********************************************
*    Row   * Instance *         z *     theta *
***********************************************
*        4 *       17 * -15.16831 * 27.436006 *
*       17 *       23 * -17.32491 * 26.818965 *
***********************************************
==> 2 selected entries

>>> z>-20 && CUTG
***********************************************
*    Row   * Instance *         z *     theta *
***********************************************
*        4 *       17 * -15.16831 * 27.436006 *
***********************************************
==> 1 selected entry

As you can see the selection z>-20 and CUTG used separately give the same output. but when I use both ie: z>-20 && CUTG then only one event shows up. That’s wrong obviously … I have no answer yet. When you invert the selection (CUTG first) then the 2 events show up …

The documentation says that the first and last points should be the same, i.e. a closed polygon. Could this be the issue in your example (I can’t test it at the moment)? maybe also in the original problem?

No it is not the problem. Just to be sure I tried with:

{
   auto file = new TFile("ptmac.root");

   TCutG *gcut = new TCutG("CUTG",5);
   gcut->SetVarX("z");
   gcut->SetVarY("theta");
   gcut->SetPoint(0,-30,2);
   gcut->SetPoint(1,-10,5);
   gcut->SetPoint(2,-5,40);
   gcut->SetPoint(3,-50,25);
   gcut->SetPoint(4,-30,2);

   int f = 3;
   int n = 18-f;

   tree->Scan("z:theta","z>-20","",15,3);
   tree->Scan("z:theta","CUTG","",15,3);
   tree->Scan("z:theta","z>-20 && CUTG","",15,3);
}

and I get:

Processing ptmac.C...
***********************************************
*    Row   * Instance *         z *     theta *
***********************************************
*        4 *       17 * -15.16831 * 27.436006 *
*       17 *       23 * -17.32491 * 26.818965 *
***********************************************
==> 2 selected entries
***********************************************
*    Row   * Instance *         z *     theta *
***********************************************
Before IsInside : instance = 17 code = 1 , xcut = -15.1683 , ycut = 27.436
*        4 *       17 * -15.16831 * 27.436006 *
Before IsInside : instance = 23 code = 1 , xcut = -17.3249 , ycut = -10000
***********************************************
==> 1 selected entry

Actually I put some debug print out juste before the call to the method deciding whether the point is inside the cut or not (IsInside). The point (xcut,ycut) is passed to this method. and as you can this yciut is wrong (-10000 instead of 26.818965). The the cut it self if fine but the point passed to it is wrong.

How did you manage to get the debug printout inside the Scan() function?