hi
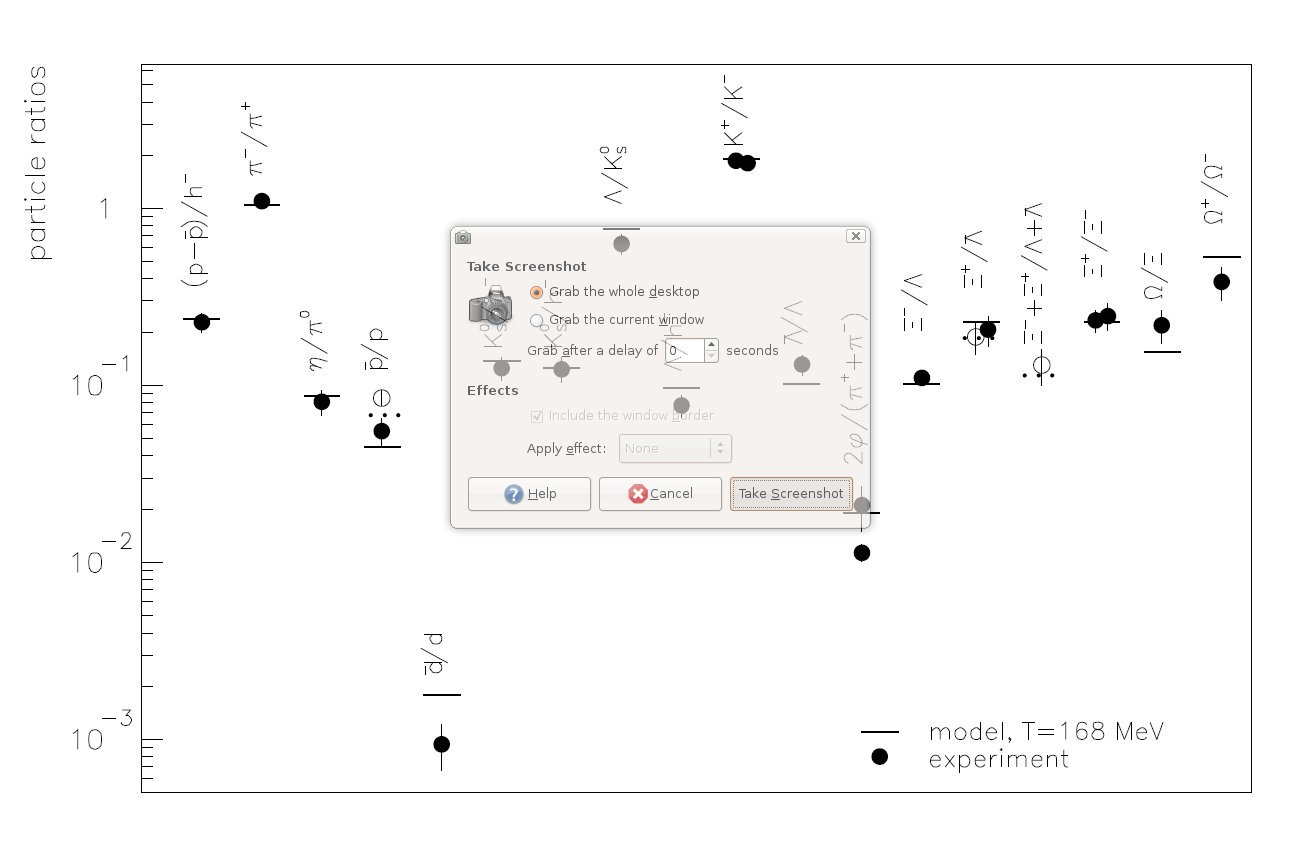
can anybody tell me how to make a graph like below in root???
regards and thanks for help
florian
(of cause without the snapshot window (stupid program…))
Try this example
void demo() {
   const int N = 12;
   double x[N] = {1,   2, 2.5,  3,   3.5,4.5, 6,  7,  8,  9,  11,  12};
   double y[N] = {0.1,0.5,0.07,0.06,0.03,0.6,0.1,0.3,0.4,0.5, 0.6, 0.7};
   double ex[N] = {0.05,0.05,0.05,0.05,0.05,0.06,0.05,0.05,0.05,0.05,0.05,0.05};
   double ey[N] = {0.02,0.01,0.02,0.02,0.01,0.06,0.02,0.05,0.10,0.15,0.15,0.15};
   const char* labels[N] = {
      "(p-p)/h^{-}",
      "#pi^{-}/#pi^{+}",
      "#eta^{-}/#pi^{+}",
      "4",
      "5",
      "6",
      "7",
      "8",
      "9",
      "10",
      "11",
      "#eta^{+}/#eta^{-}"
   };
   TCanvas *c1 = new TCanvas("c1");
   c1->SetLogy();
   c1->SetGridx();
   c1->SetGridy();
   TGraphErrors *gr = new TGraphErrors(N,x,y,ex,ey);
   gr->SetMarkerStyle(21);
   gr->SetMaximum(3);
   gr->SetMinimum(4e-4);
   gr->Draw("ap");
   gr->GetYaxis()->SetTitle("particle ratios");
   TLatex l;
   l.SetTextSize(0.03);
   l.SetTextAngle(90);
   l.SetTextAlign(12);
   for (int i=0;i<N;i++) {
      l.DrawLatex(x[i],y[i]*1.3,labels[i]);
   }
}
Rene
thats exactly what I want… thanks a lot
regards
flori
hi
I have a few more questions…
- How is it possible to get Markers like in the picture (the long black lines) because in TAttMarker I found only point like styles…
- how is it possible to set particle names like pi or eta on the x-axis? instead of other labeling…
- How can I change the label-step size of an axis, if I want for example only the highest and the lowest value (10 and 0 instead on 10,9,8,7,6,5,4,3,2,1).
- is there a good tutorial where I can find all this stuff, because there are only a few tutorials in the internet available and all of them are very basic…
thanks for help
best regards
florian

See also the new feature:
root.cern.ch/doc/master/classTGaxis.html#GA10a