Dear ROOTERS,
what do I have to do to draw correctly the TF1 and the TGraphErrors in the test.root file… ?
void mytest() {
    TFile f("test.root") ;
    TF1 *func = (TF1*) f.Get("func;1") ;
    TGraphErrors *graph = (TGraphErrors*) f.Get("Graph;1") ;

    graph->Draw("AP") ;
    func->Draw("SAME") ;
}
there is a bug in the upper left corner
btw, the bug is still visible in the latex version with a gPad->Print(“test.tex”)
Thankstest.root (6.39 KB)
couet
December 4, 2014, 1:53pm
2
What do you mean ? your macro gives something which looks fine. i.e.:
a set of error bars produced by TGraphErrors
a function drawn as a line produce by TF1.
what do you think in not correct ??
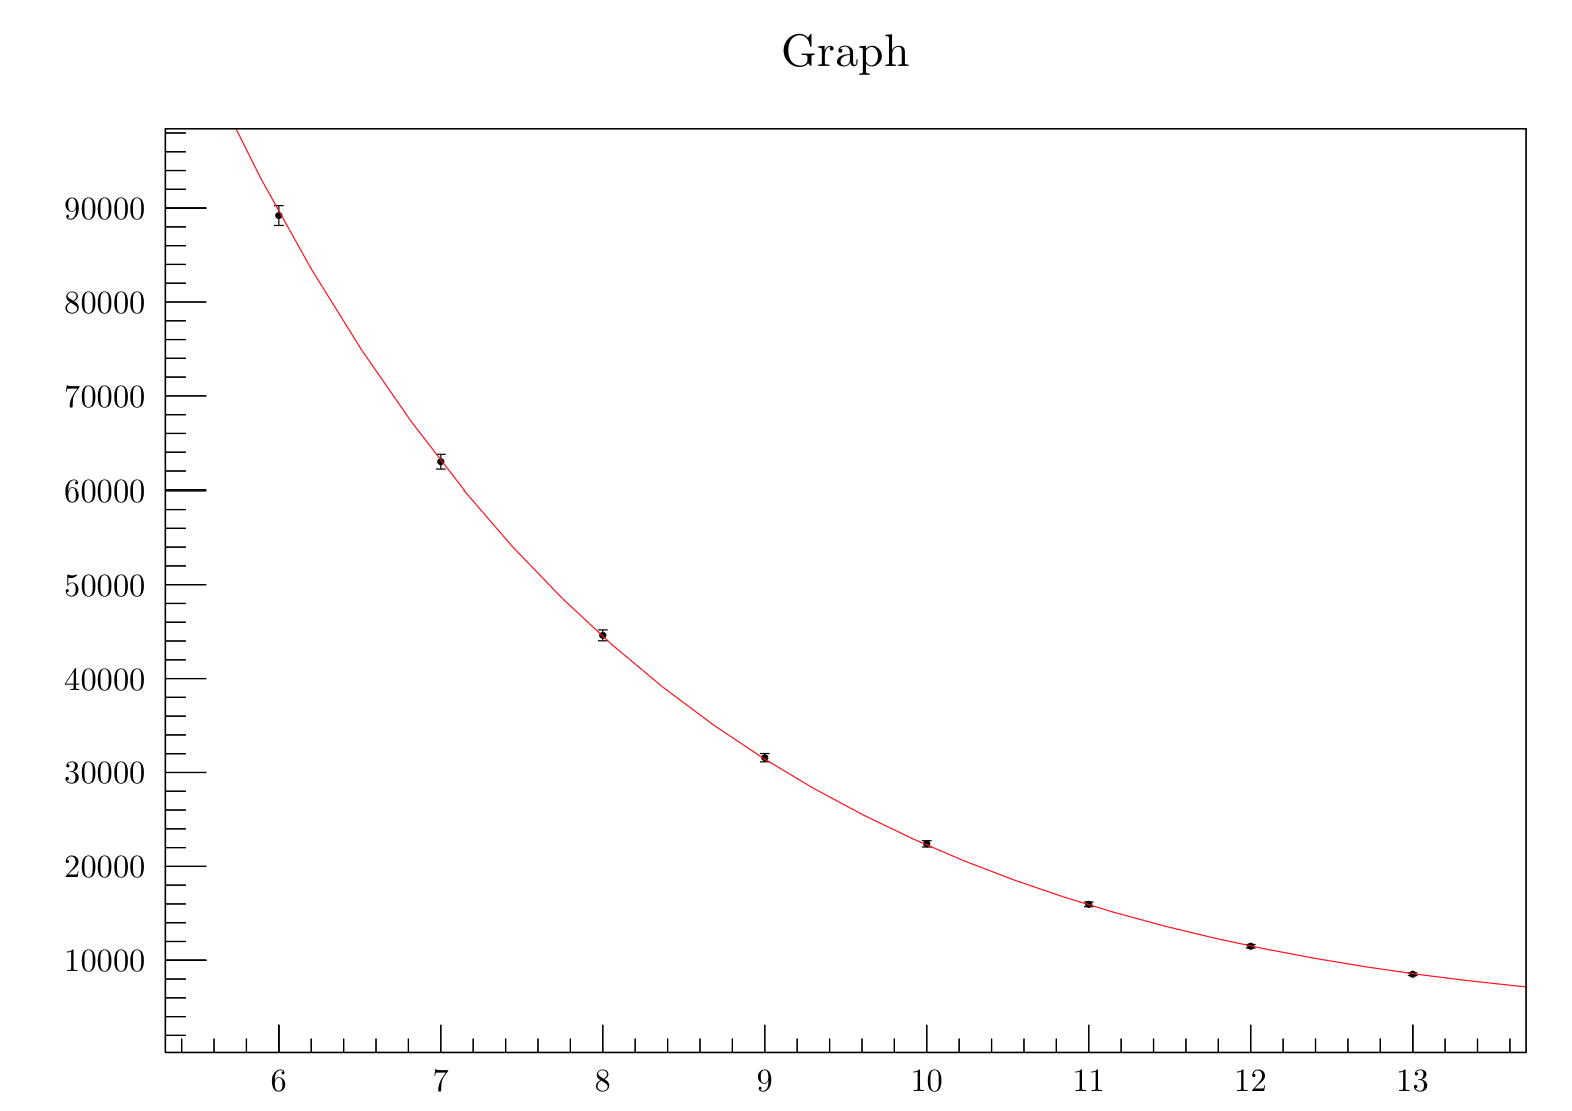
No there is a bug… the cuve has a strange angular singularity next to the upper horyzontal axis
in canvas.pdf
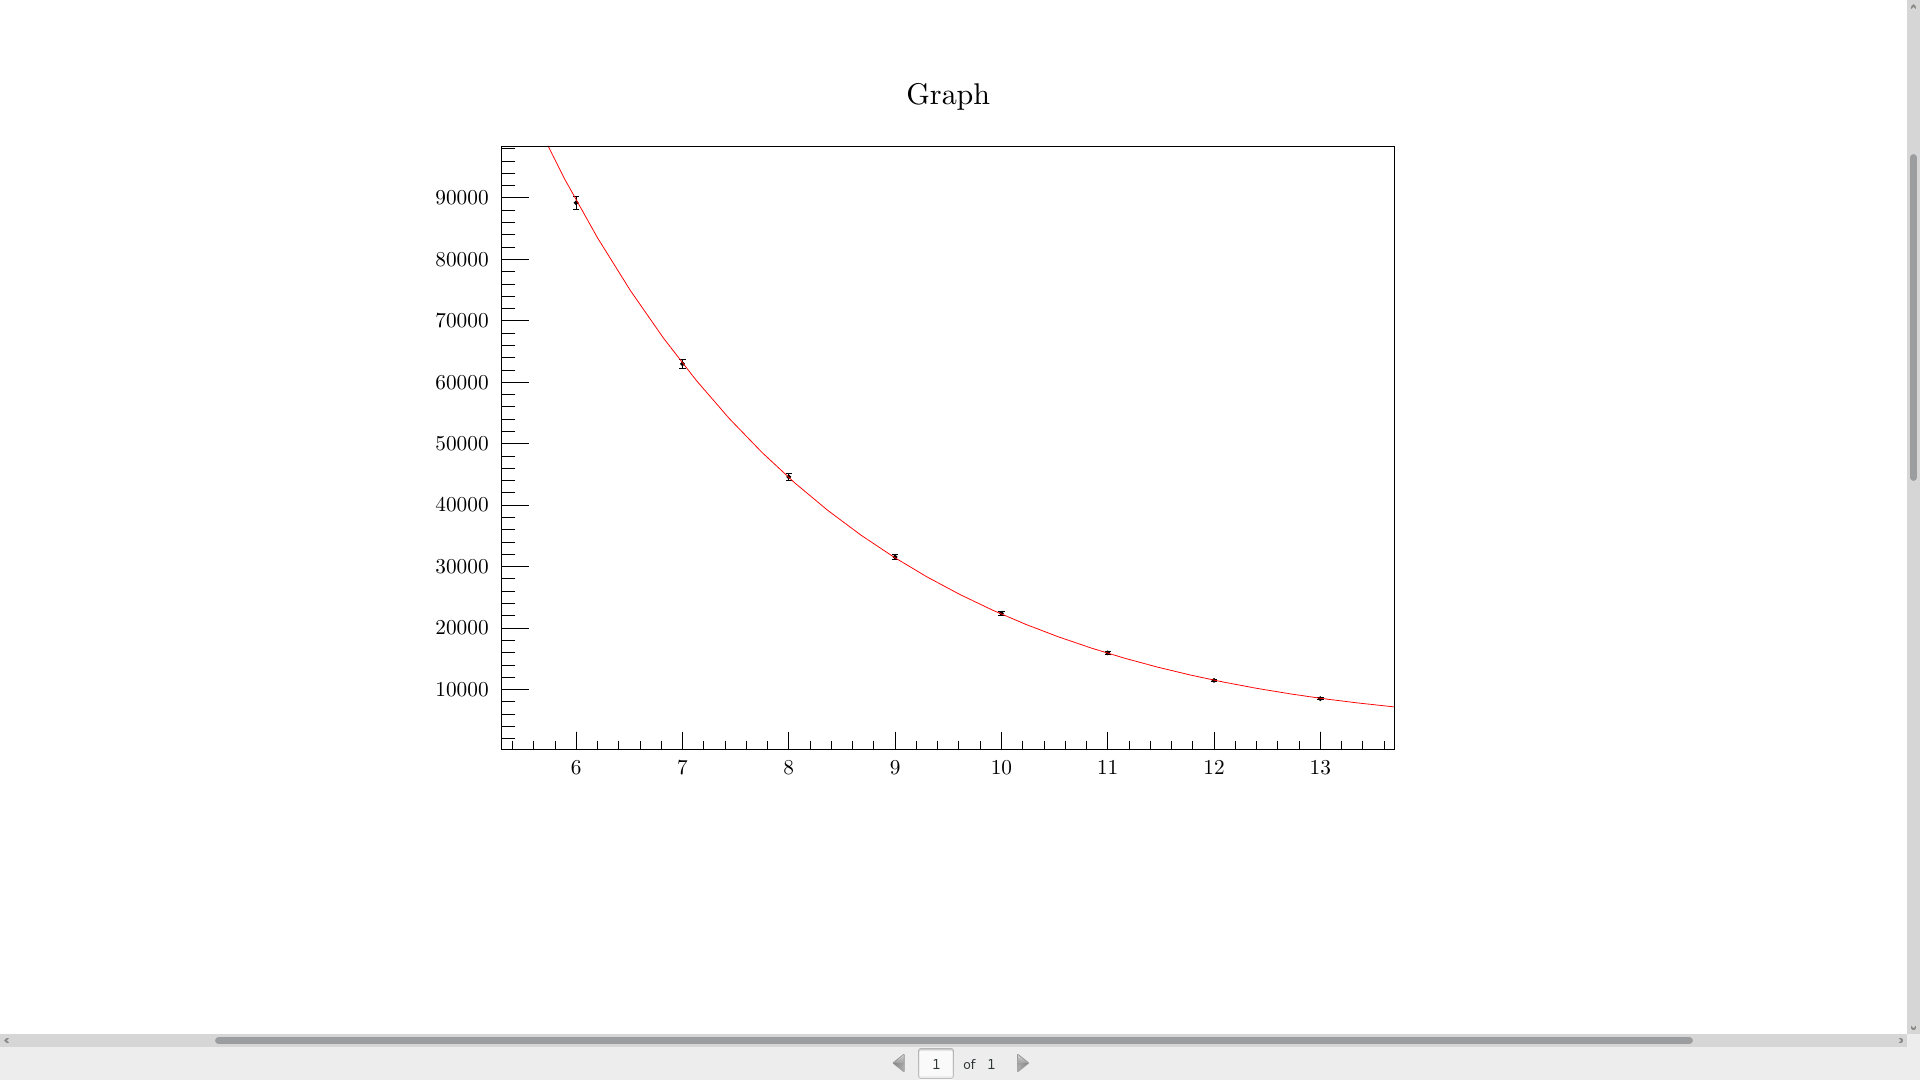
in latexcanvas.pdf
I want to redraw the frame so :
couet
December 4, 2014, 2:13pm
4
void mytest() {
    TFile f("test.root") ;
    TF1 *func = (TF1*) f.Get("func;1") ;
    TGraphErrors *graph = (TGraphErrors*) f.Get("Graph;1") ;

    graph->Draw("AP") ;
    func->Draw("SAME") ;
    func->GetXaxis()->SetRange(6,100);
}
So it’s a bug ?.. (and sometimes the angular point is much much bigger, with “test.root” I just provided a way to reproduce the “bug”)
Your solution works but I can’t do that on a “case by case basis”.
I want to redraw the frame so :
no more bug in the curve
I cant’do something like :
    double coef = 1.05 ;
    graph->GetXaxis()->SetLimits(coef * graph->GetXaxis()->GetXmin(),coef * graph->GetXaxis()->GetXmax()) ;
    graph->GetHistogram()->SetMinimum(coef * graph->GetHistogram()->GetMinimum()) ;
    graph->GetHistogram()->SetMaximum(coef * graph->GetHistogram()->GetMaximum()) ;
it’s not going to work in the long term, it’s artificial and ugly
couet
December 4, 2014, 2:47pm
6
or:
void mytest() {
    TFile f("test.root") ;
    TF1 *func = (TF1*) f.Get("func;1") ;
    TGraphErrors *graph = (TGraphErrors*) f.Get("Graph;1") ;

    graph->Draw("AP") ;
    func->Draw("SAME") ;
    func->SetNpx(2000);
}
Thanks for this new solution,
it’s much better
but I still would like to redraw the upper horizontal axis so the red would not be on top of the original black axis…latexcanvas.pdf (33.4 KB)canvas.pdf (27 KB)
couet
December 4, 2014, 3:13pm
8
There is an “How To” on that exact question:
root.cern.ch/drupal/content/how- … ot-borders
Thanks for your help.
void redrawBorder()
{
gPad->Update();
gPad->RedrawAxis();
TLine l;
l.DrawLine(gPad->GetUxmin(), gPad->GetUymax(), gPad->GetUxmax(), gPad->GetUymax());
l.DrawLine(gPad->GetUxmax(), gPad->GetUymin(), gPad->GetUxmax(), gPad->GetUymax());
}
void mytest() {
TFile f("test.root") ;
func = (TF1*) f.Get("func;1") ;
graph = (TGraphErrors*) f.Get("Graph;1") ;
graph->Draw("AP") ;
func->Draw("SAME") ;
func->SetNpx(2000) ;
func->SetLineWidth(0) ;
redrawBorder() ;
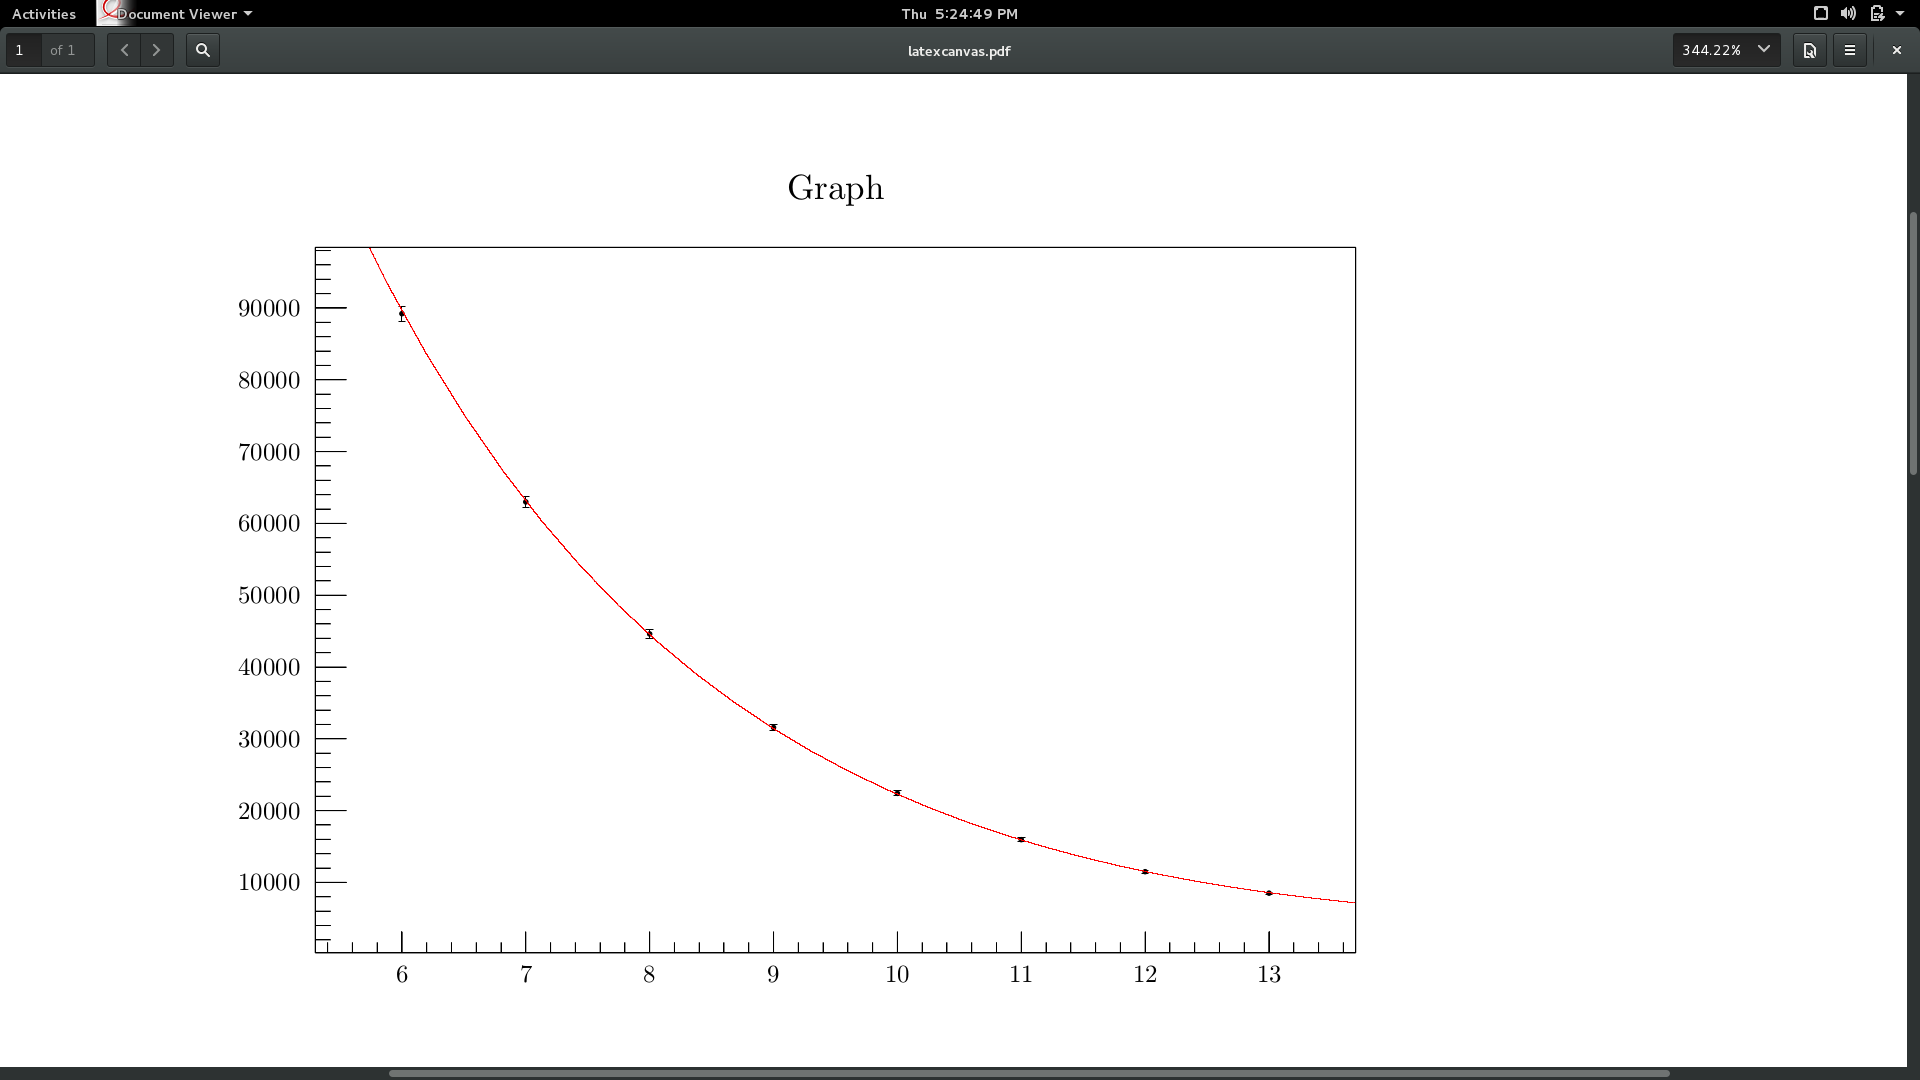
}Any advice to improve the smoothness of the curve in the latex version ?latexcanvas.pdf (94.1 KB)canvas.pdf (73.2 KB)
couet
December 4, 2014, 4:06pm
10
I am looking at it now on my screen … how it can smoother than what I am seeing ? ( see my screen dump)
Ok
I just downloaded Okular and the curve is smooth…
Thanks
couet
December 4, 2014, 4:38pm
12
THE Reference in the pdf viewers’ field is Adobe Acrobat.