I am experiencing a very strange problem with linear and log scales.
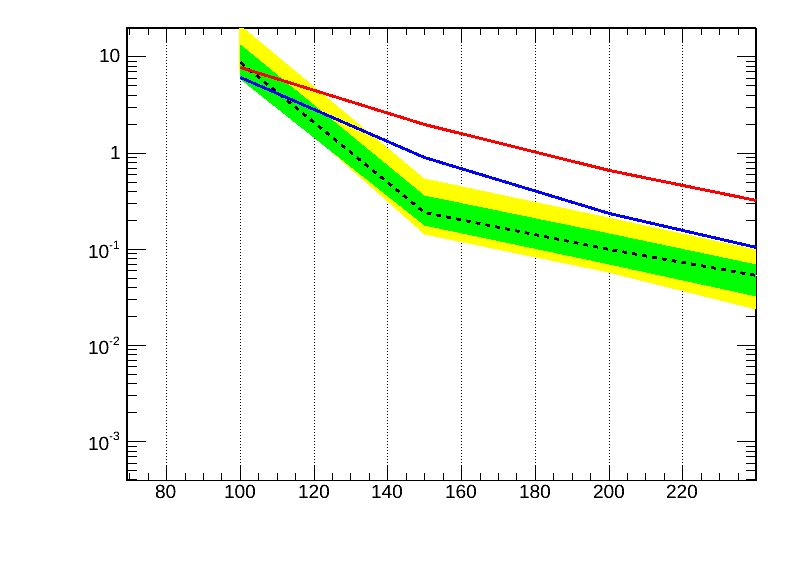
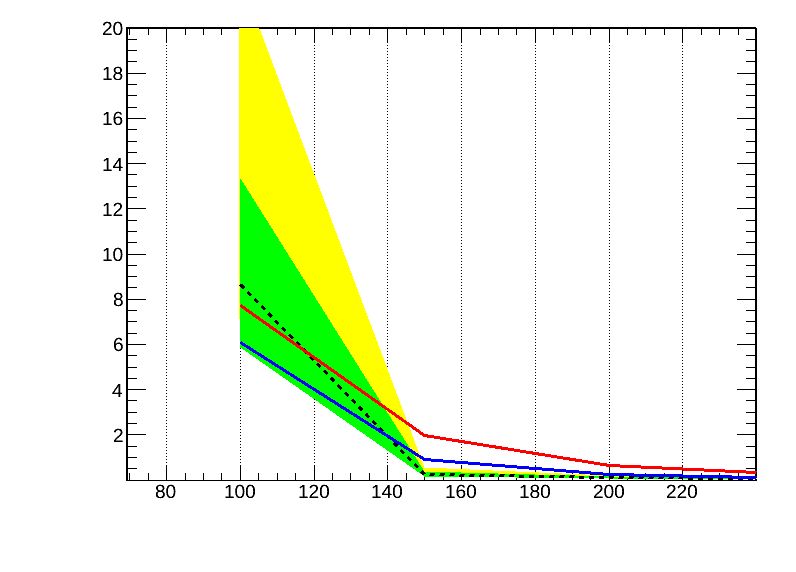
I attached the same plot in lin and log scale.
I found strange that the intersection of the blue line and black dashed line happens in a different place.
In linear scale is ~140 while in log scale is ~110
did I overlook something?
[EDIT]
I can’t figure out why in log scale the lines at 110 have a different value in lin and log scale.
(i.e. in log scale they are ~4 while in linear scale one is 5 and the other is 7)
When you draw a graph in log scale the points building up the graphs are turned into log.
If you draw the graph with the option L these points converted into log are connected with straight lines.
That’s just a linear connection. The points belonging to these lines and not part of the graph
are, therefore, not in log scale. The effect is more obvious when you have only a few points like in
your case (you have only 3). You can bypass this by injecting more points in the graph.
{
   // A graph with 3 points
   Double_t xmin = 750.;
   Double_t xmax = 1000;
   TGraph* g = new TGraph(3);
   g->SetPoint(0,xmin,0.1);
   g->SetPoint(1,845,0.06504);
   g->SetPoint(2,xmax,0.008);

   // the same graph with n points
   Int_t n = 1000;
   Double_t dx = (xmax-xmin)/n;
   Double_t x = xmin;
   TGraph*g2 = new TGraph();
   for (Int_t i=0; i<n; i++) {
      g2->SetPoint(i, x, g->Eval(x));
      x = x + dx;
   }

   TCanvas* cv = new TCanvas("cv","cv",800,600);
   cv->SetLogy();
   cv->SetGridx();
   cv->SetGridy();
   g->Draw("AL*");
   g2->SetMarkerColor(kRed);
   g2->SetMarkerStyle(1);
   g2->Draw("P");
}