Hii
I am trying to set a title in a divided canvas. But until now I am unable to do that. I would be grateful if anyone checks that out.
So the code is like this;
TCanvas c15("c15", "VTPC1 1D ResX distr in Sectors", 1024, 768);
c15.SetTitle("VTPC1");
  c15.UseCurrentStyle();
  c15.Divide(3,2);
  for (int i = 0; i < 6; i ++){
  c15.cd(i+1);
  gPad->SetLogy();
  gPad->SetLeftMargin(0.09);
  gPad->SetRightMargin(0.1);
  gPad->SetTopMargin(0.2);
  gPad->SetBottomMargin(0.05);
  gPad->Update();
  gPad->Modified();
  VTPC1_DX_distr[i]->SetTitle("");
  VTPC1_DX_distr[i]->GetXaxis()->SetLabelSize(0.05);
  VTPC1_DX_distr[i]->GetYaxis()->SetLabelSize(0.05);
  VTPC1_DX_distr[i]->GetXaxis()->SetTitleOffset(-0.5);
  VTPC1_DX_distr[i]->GetXaxis()->SetTitleSize(0.07);
  VTPC1_DX_distr[i]->GetYaxis()->SetTitleOffset(-0.6);
  VTPC1_DX_distr[i]->GetYaxis()->SetTitleSize(0.07);
  VTPC1_DX_distr[i]->SetMarkerStyle(21);
  VTPC1_DX_distr[i]->SetMarkerColor(kRed);
  VTPC1_DX_distr[i]->SetMarkerSize(0.4);
  VTPC1_DX_distr[i]->GetYaxis()->SetTitle("N_{entries} ");
  VTPC1_DX_distr[i]->GetXaxis()->SetTitle("X - X_{fit}");
  VTPC1_DX_distr[i]->Draw("E");
  //VTPC1_DX_distrMC[i]->Draw("HISTSAME");
  }
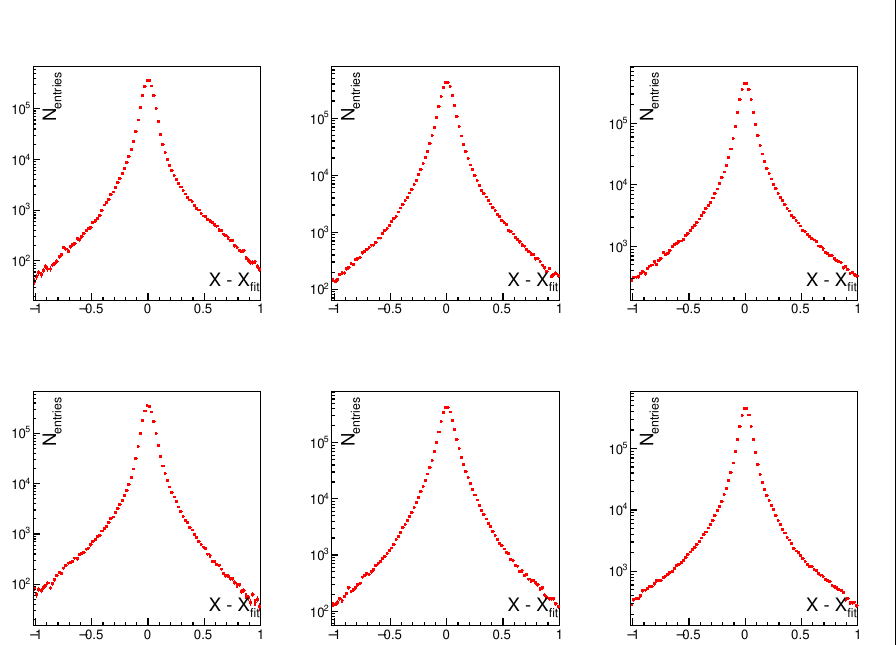
The plot is attached here.
Also I want to give titles to different sectors. How can I do that?
Thank you. Its done now giving the title to the whole canvas. Another thing is giving individual names to individual histograms. I tried using TStrings but i got the “break segmentation error”. Can you please tell me how can I solve that.
Then I try to plot them in canvas.
here i = 6
The code for plotting is;
  gStyle->SetOptFit(0);
  gStyle->SetOptStat(0);
  gStyle->SetStatW(0.6);
  gStyle->SetStatH(0.8);
  gStyle->SetStatX(0.85);
  gStyle->SetStatY(0.20);
  gStyle->SetPadBottomMargin(.1);

  TPaveText *t101 = new TPaveText(0.01,0.92,0.99,0.97,"Title");
  t101->SetBorderSize(0);
  t101->SetFillColor(10);
  t101->SetTextSize(.03);
  t101->AddText(" VTPC1: X - X_{fit} ");

//VTPC1_DX_distrMC[i]->Draw("HISTSAME");
  TCanvas c15("c15", "VTPC1 1D ResX distr in Sectors", 1024, 768);
  TPad *pad1 = new TPad("pad1","",0.03,0.02,0.97,0.90);
  pad1->Draw();
  t101->Draw();
  pad1->Divide(3,2);
  for (int i = 0; i < 6; i ++){
  pad1->cd(i+1);
  gPad->SetLeftMargin(0.08);
  gPad->SetRightMargin(0.0);
  gPad->SetTopMargin(0.0);
  gPad->SetBottomMargin(0.05);
  gPad->SetLogy();
  VTPC1_DX_distr[i]->SetTitle("VTPC1%d");
  VTPC1_DX_distr[i]->GetXaxis()->SetLabelSize(0.05);
  VTPC1_DX_distr[i]->GetYaxis()->SetLabelSize(0.05);
  VTPC1_DX_distr[i]->GetXaxis()->SetTitleOffset(-0.5);
  VTPC1_DX_distr[i]->GetXaxis()->SetTitleSize(0.05);
  VTPC1_DX_distr[i]->GetYaxis()->SetTitleOffset(-0.6);
  VTPC1_DX_distr[i]->GetYaxis()->SetTitleSize(0.07);
  VTPC1_DX_distr[i]->SetMarkerStyle(21);
  VTPC1_DX_distr[i]->SetMarkerColor(kRed);
  VTPC1_DX_distr[i]->SetMarkerSize(0.4);
  VTPC1_DX_distr[i]->GetYaxis()->SetTitle("N_{entries} ");
  VTPC1_DX_distr[i]->GetXaxis()->SetTitle("X - X_{fit}");
  VTPC1_DX_distr[i]->Draw("E");
  }
So here I have to change the name of the titles of each histogram. Because they already have names from the previous root file.
For example,
for VTPC1_DX_distr[i] , the titles come out to be VTPCResYDistSec1, VTPCResYDistSec2, VTPCResYDistSec3, VTPCResYDistSec4,VTPCResYDistSec5, VTPCResYDistSec6 (from the previous root file). Now I want to change the names as Sector1, Sector2, Sector3, Sector4, Sector5, Sector6.
So what code should I write to change the names of histograms.