GetValueColor from TPaletteAxis with logZ axis

Hello,

I am plotting a TH2 with log scale on Z axis in the following way:

  gPad->SetLogz();
  h_vals->Draw("colz");
  gPad->Update();

Now, what I would like to do is taking the color of the Z axis and use them in other part of the code. My strategy in this moment is to pick up the palette and use GetValueColor:

  auto* palette = dynamic_cast<TPaletteAxis*>(h_vals->GetListOfFunctions()->FindObject("palette"));
  // first for main cell value histogram
  double binc = h_vals->GetBinContent(get_bin_number(this_bin));
  Int_t color_id = palette->GetValueColor(binc);

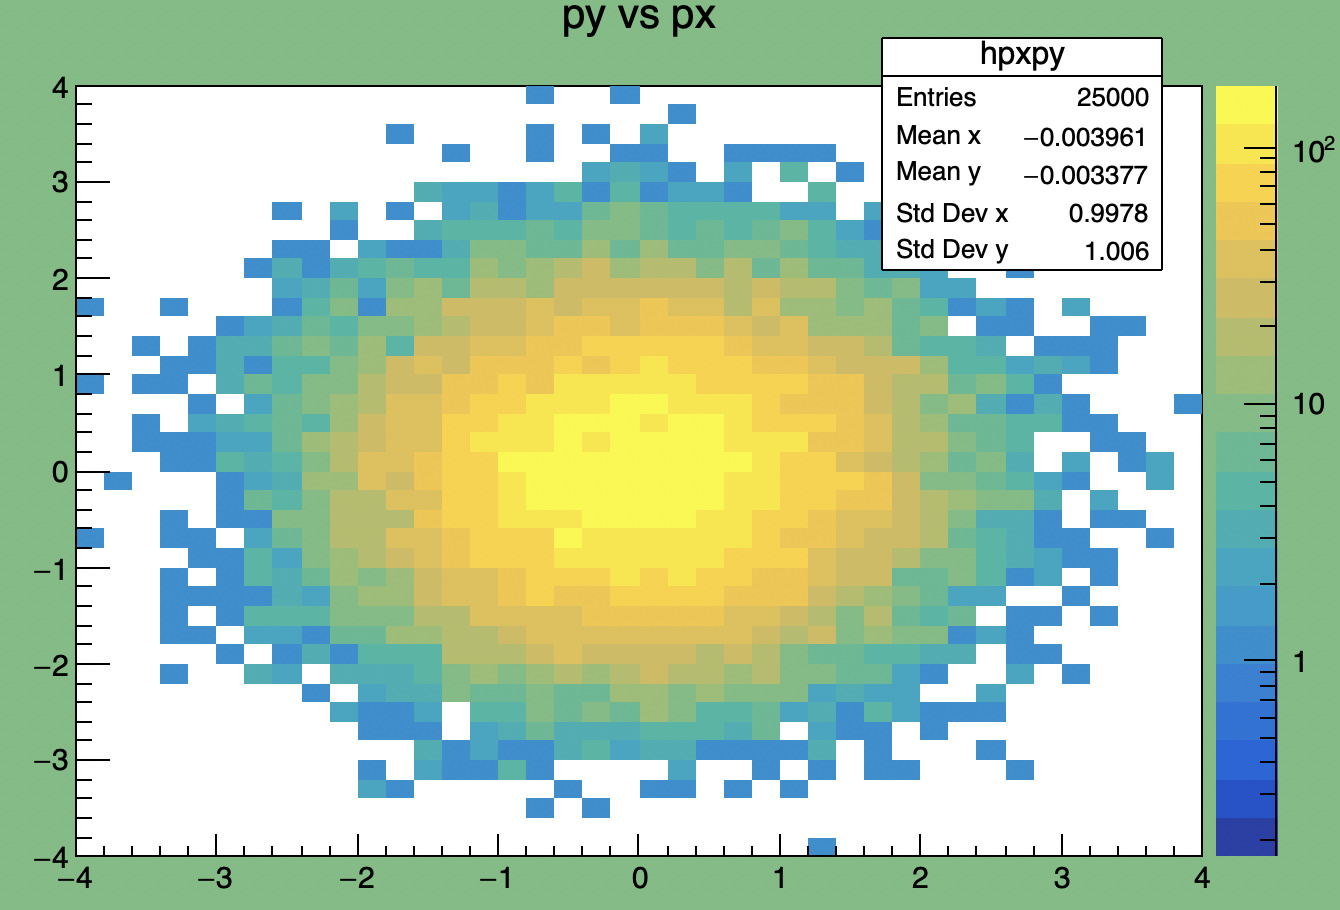
This does not work as expected, as you can see in the following plot
example_Log.pdf (25.0 KB)
Do you have any suggestions on how to fix it or test the problem in a better way?

Thanks,
Erica


ROOT Version: 6.06.06
Platform: slc6
Compiler: clang


Does it work if you do not set the log scale along Z ?

Yes, here the result
example.pdf (23.3 KB)

I tried to reproduce it and I see there is a problem in log Z

root [0]  hpxpy->Draw("COLZ");
Info in <TCanvas::MakeDefCanvas>:  created default TCanvas with name c1
root [1] gPad->SetLogz()
root [2] TPaletteAxis *palette = (TPaletteAxis*)hpxpy->GetListOfFunctions()->FindObject("palette");
root [3] Int_t ci = palette->GetValueColor(1.);
root [4] TColor *c = gROOT->GetColor(ci);
root [5] float r,g,b;
root [6]  c->GetRGB(r,g,b);
root [7] r
(float) 0.453559f
root [8] g
(float) 0.742331f
root [9] b
(float) 0.504766f
root [10] ci
(int) 1076
root [11] gPad->SetFillColor(1076)

I asked color for 1 and it seems more like the one for 10

I found a workaround. If you take the log of the value you want find the color for ,then it is ok. In my example it would be:

   Int_t ci = palette->GetValueColor(TMath::Log10(1.));

This seems a nice workaround.
Thanks!

1 Like

This topic was automatically closed 14 days after the last reply. New replies are no longer allowed.