Diego
March 26, 2018, 1:54pm
1
Dear all,
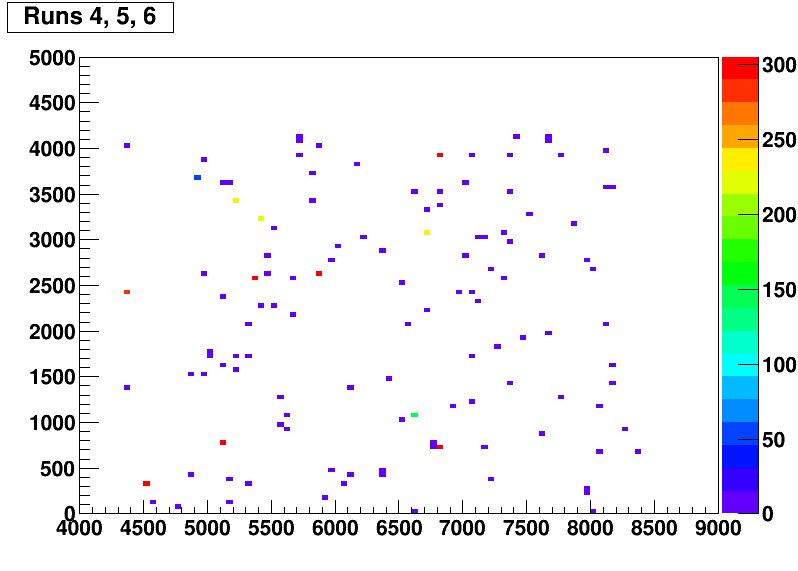
After filling a 2D histogram, I need to store
the bin content higher than a given threshold and
its corresponding x-y positions.
How to proceed to get these latter?
Cheers,
Diego
plotDataV2.C (2.2 KB)
couet
March 26, 2018, 3:20pm
2
You mean the bin contain just above a given threshold: the minimum of the values above the threshold ?
You may have several bins containing this value. So a single x,y position does not make sense.
Diego
March 26, 2018, 3:33pm
3
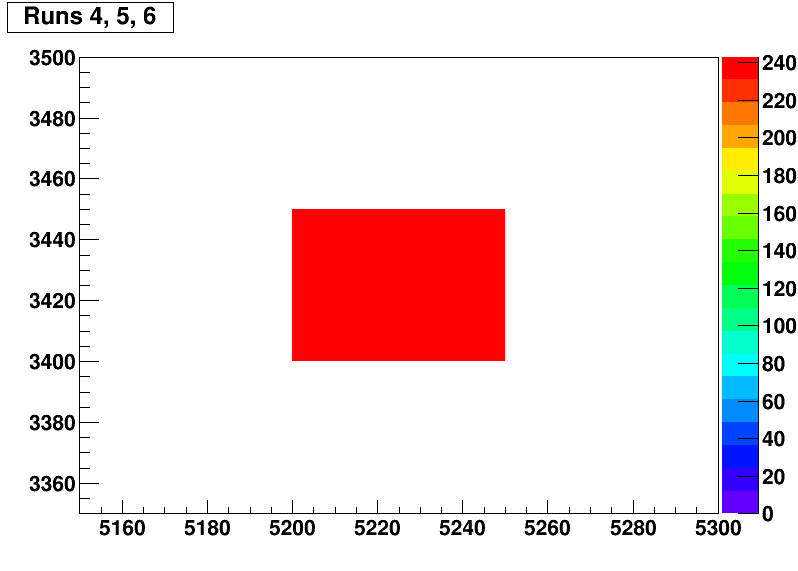
Dear Couet, thanks for answering. I just need the values of the axis for a given bin. In the example above, a given bin with 240 entries, the values are 5200 for x and 3400 for y. So I would like to get that automatically, without looking to the image.
Cheers,
Diego
Something like plotDataV3.C (2.3 KB)
1 Like
Diego
March 27, 2018, 1:50pm
5
Thanks! It was exactly what I was looking for!
Cheers,
Diego
system
April 10, 2018, 1:51pm
6
This topic was automatically closed 14 days after the last reply. New replies are no longer allowed.