Getting a normal graph of two arrays

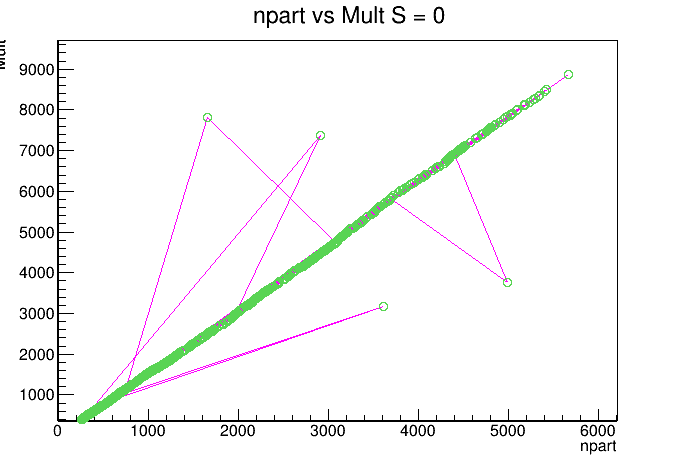
I am trying to get a TGrpah between two arrays but the graph I am getting is not a normal curve or line graph. It comes out as a straight line but when I click the data points it comes out like this.

I just need a simple graph.
Also I need a TProfile graph but I am confused about the limits on its axes.
A3.C (14.2 KB)
https://drive.google.com/file/d/1C1CxNKAxMEriGhhP0YFxJz922MqaYgAR/view?usp=sharing

I cannot access your data file

You macro produces 7 canvases but none of them shows the plot you posted.

Its the npart vs Mult S = 0 plot. If you click on those green data points you can drag and drop them like I had done in the previous post. I want to know why this plot comes out like this and not just a solid line with data points just like any normal graph.

Before drawing: some_graph->Sort();

If you mean you want to “lock” the points, so that they cannot be dragged with a mouse, you can do:

 graph->SetEditable(0);
1 Like

Because you asked for it with te P option in the Draw() command. Do:

gr5->Draw("AL");

And the marker will go away.

1 Like

This topic was automatically closed 14 days after the last reply. New replies are no longer allowed.