Dear List,
I’ve got an MxN matrix dataset which I’ve converted into an ascii file with three columns, x, y and z, where z is the weighted values of f(x,y). Plotting the ascii file using the TGraph2D constructor is not an issue.
But the problem is that I’ve got a batch of similarly structured files that need analysing. TGraph2D seems to be limited in this regard, so ideally I would like to do this using the 2D histograms. However I can’t get an identical result when using 2D histograms. Is there something I am missing perhaps? 
Any help would be greatly appreciated! 
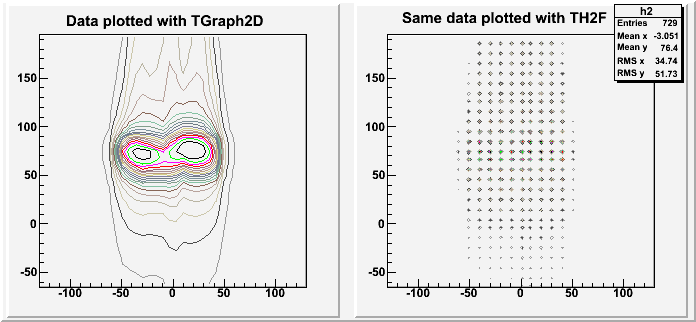
See below for macro script and output showing the same plot for TGraph2d vs. TH2F
Thanks.
#include "Riostream.h"

void Sample() {
// Reads data from an ascii file with Z as weighted values of function f(x,y)
// and plot as 2D histogram.
   TString dir = gSystem->UnixPathName(gInterpreter->GetCurrentMacroName());
   dir.ReplaceAll("Sample.C","");
   dir.ReplaceAll("/./","/");
   ifstream in;
   in.open(Form("%sMeasured.dat",dir.Data()));
//
//::::::::: 3 coluns of data x, y, z, where z is weighted function f(x,y)
//
// First use TGraph2D constructor to see what plot looks like:
   TCanvas *c1 = new TCanvas("c1"," ",0,0,700,350);
   c1->Divide(2,1);
   c1->cd(1);
   TGraph2D *g1 = new TGraph2D("Measured.dat");
   g1->Draw("cont1");
//
// Next repeat process by reading in ascii file into 2D histo and plotting
   c1->cd(2);
   Float_t x,y,z;
   Int_t nlines = 0;
//   TFile *f = new TFile("Sample.root","RECREATE");
   TH2F *h2 = new TH2F("h2","Same Measured Data with 2DHisto",100,-130,130,100,-65,195);
   while (1) {
      in >> x >> y >> z;
      if (!in.good()) break;
      h2->Fill(x,y,z);
      nlines++;
   }
   printf(" found %d points\n",nlines);
   in.close();
   h2->Draw("cont1");
//   f->Write();
   c1->Update();
}
For data used to generate plots see
Measured.dat (12.3 KB)
 !
!