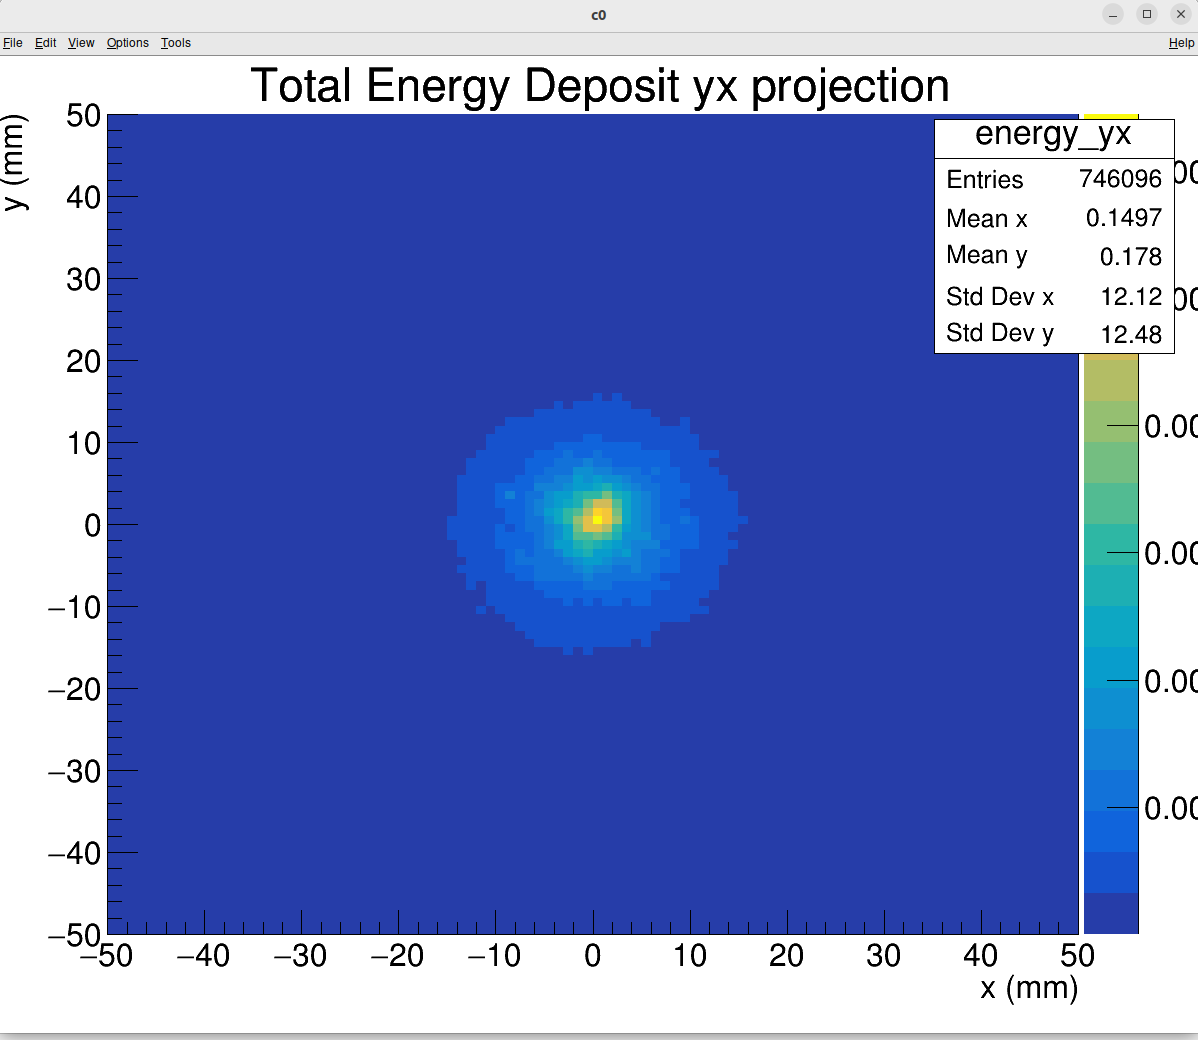
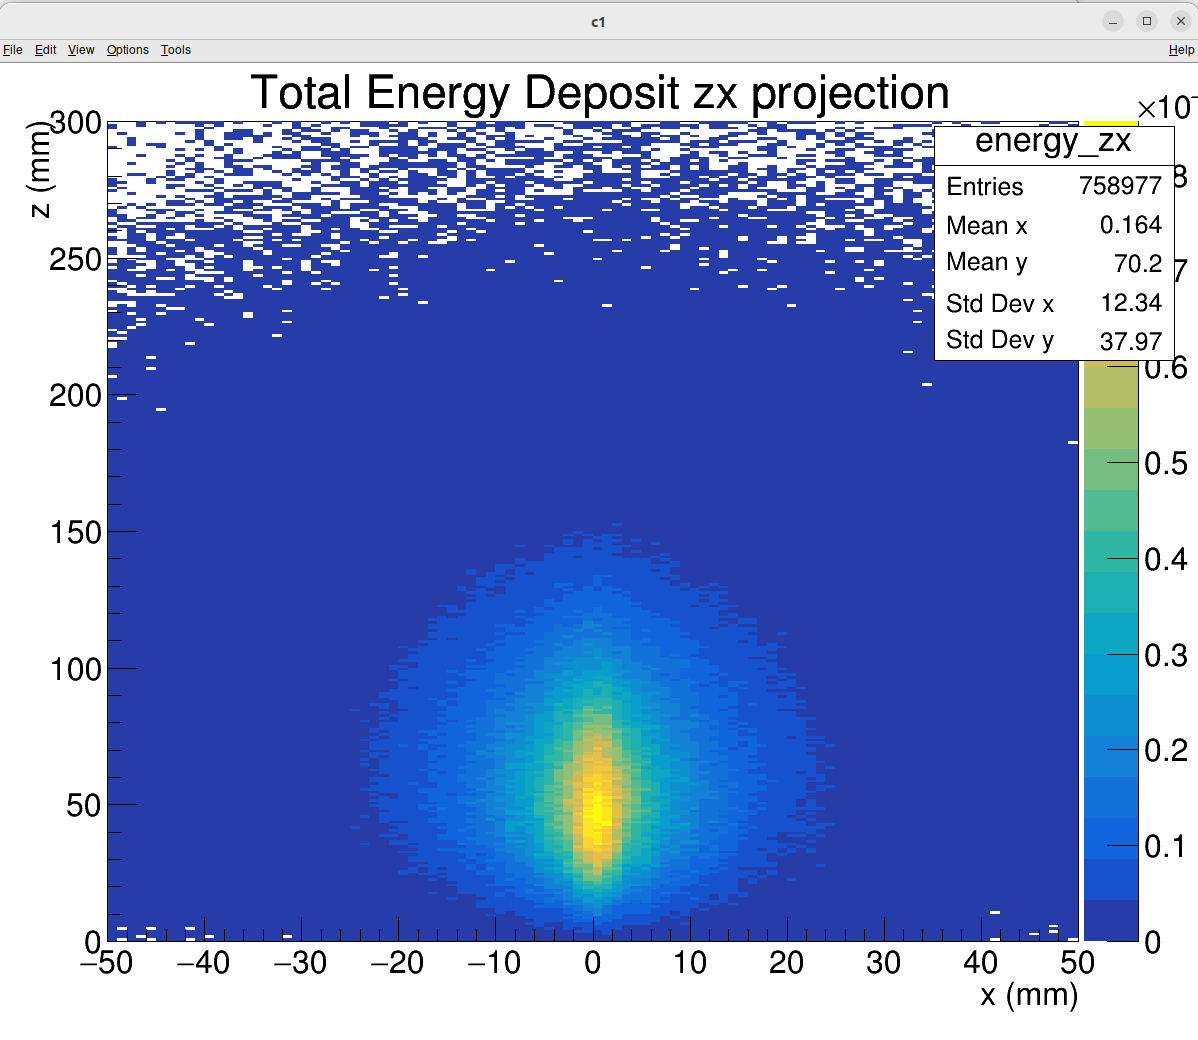
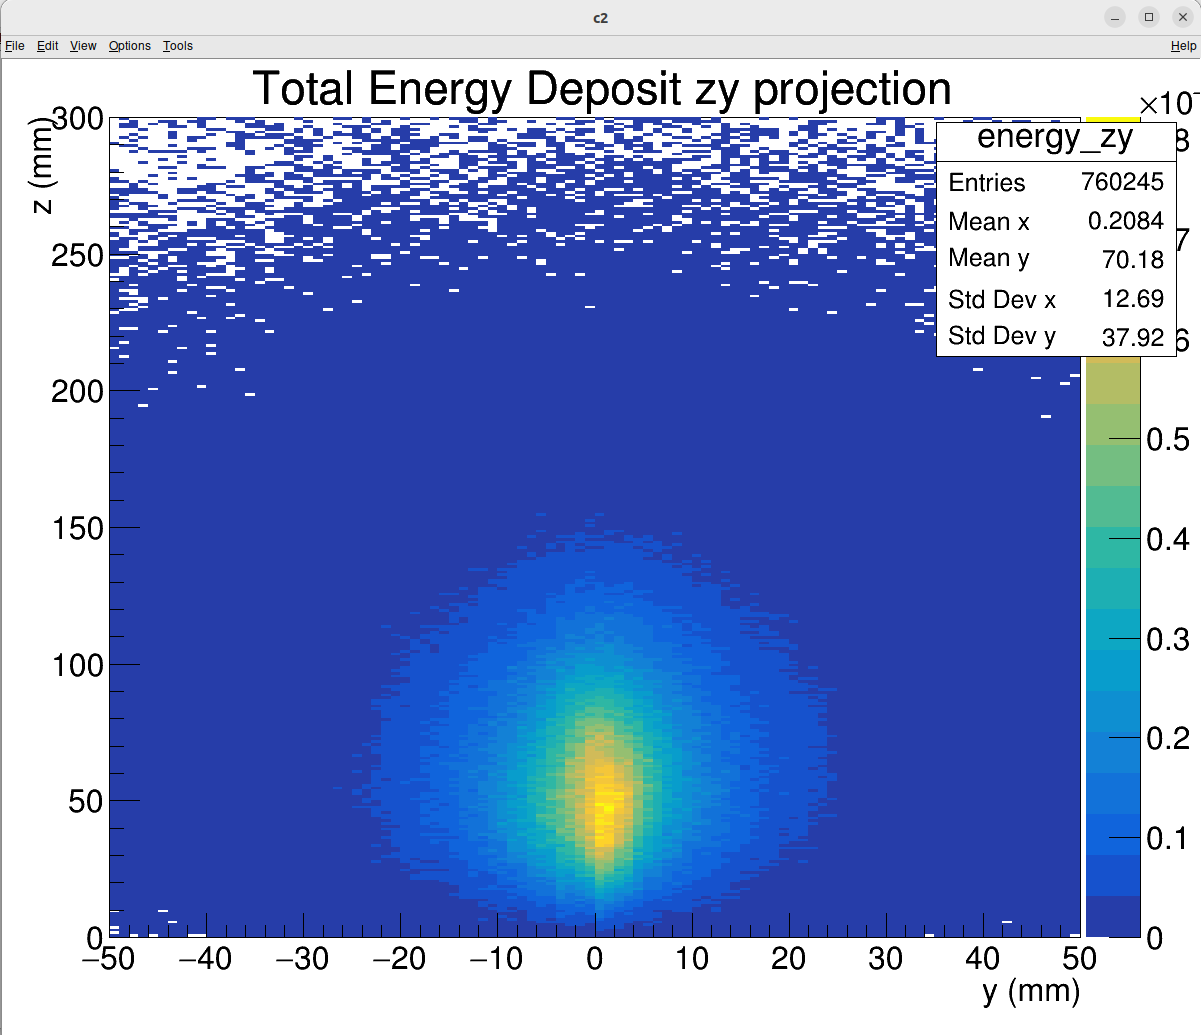
Here is my complete code: I just want to add Smearing of 1cm to these three projections
#include <iostream>
#include <iomanip>
#include <sstream>
#include <fstream>
#include <string>
#include <vector>
#include <map>
#include <stdlib.h>

#include "TROOT.h"
#include "TTree.h"
#include "TChain.h"
#include "TFile.h"
#include "TString.h"
#include "TSystem.h"
#include "TCanvas.h"
#include "TLegend.h"
#include "TH1.h"
#include "TH2.h"
#include "TH3.h"
#include "TColor.h"
#include "Riostream.h"
#include "TDatime.h"
#include "TMath.h"
#include "TStyle.h"
#include "TLorentzVector.h"

#include <TTreeReader.h>
#include <TTreeReaderValue.h>
#include <TTreeReaderArray.h>


stringstream ss;

void crystal_dep()
{

   gROOT->ForceStyle();

    // *************************************************************************
    // Rootfile and Tree
    TFile* f = new TFile("lumidet_PbWO4_1K.edm4hep.root");
    f->cd();

    //TTree* t = (TTree*)f->Get("events");
    TTreeReader myReader("events", f);                     // name of tree and file

    TTreeReaderArray<Float_t> energy(myReader, "LumiDirectPCALHits.energy");
    TTreeReaderArray<Float_t> x(myReader, "LumiDirectPCALHits.position.x");
    TTreeReaderArray<Float_t> y(myReader, "LumiDirectPCALHits.position.y");
    TTreeReaderArray<Float_t> z(myReader, "LumiDirectPCALHits.position.z");


     const int ngraph = 3;
 TCanvas * c[ngraph];
 for (int i =0; i<ngraph; ++i){
 c[i] = new TCanvas(Form("c%d",i),Form("c%d",i),1200,1000);
 c[i]->SetMargin(0.09, 0.1 ,0.1,0.06);
 }


    // Rootfile and Tree
    // *************************************************************************
    // *************************************************************************
    // Histograms
    map<string,TH3*> h3;

    float xmin = -50;
    float xmax = 50;
    int nx = 100;
    float ymin = -50;
    float ymax = 50;
    int ny = 100;
    float zmin = 66000;
    float zmax = 66300;
    int nz = 300;


    h3["energy"] = new TH3F("energy", "Total Energy Deposit;x;y;z", nx, xmin, xmax, ny, ymin, ymax, nz, 0, zmax - zmin);
    TH3F* hist3 = new TH3F("hist3", "Hit position 3D;x;y;z", 100, -50, 50, 100, -50, 50, 300, 0, 300);
    TRandom3 *rndm = new TRandom3();
    int nev = 0;
    vector<int> nphoton;
    float xxx = 0;
    float yyy = 0;
    float zzz = 0;
    float emax = 0;
    double binx= 0;
    double biny= 0;
    double binz= 0;
    while (myReader.Next())
    {
        nev++;
        cout << "Event: " << nev << endl;
        nphoton.push_back(0);
        float tot_e = 0;

        for (int i = 0; i < energy.GetSize(); i++)
        {
            nphoton.back()++;
            tot_e += energy[i];
            h3["energy"]->Fill(x[i],y[i],abs(z[i]) - zmin,energy[i]);
           // hist3->Fill(x[i],y[i],abs(z[i]) - zmin,energy[i]);
           h3["energy"]->Fill(x[i]+rndm->Gaus(0,10) ,y[i] + rndm->Gaus(0,10) , (abs(z[i]) - zmin) + rndm->Gaus(0,10) ,energy[i] );
            xxx = max(abs(x[i]), xxx);
            yyy = max(abs(y[i]), yyy);
            zzz = max(abs(z[i]), zzz);


        }
    }

    cout << "Max-X: " << xxx << endl;
    cout << "Max-Y: " << yyy << endl;
    cout << "Max-Z: " << zzz << endl;
   // hist3->Draw();
    //cout << "Energy: " << energy << "GeV" <<endl;
    // Fill Histograms
    // *************************************************************************

    // *************************************************************************
    // Draw Histograms
    for (map<string,TH3*>::const_iterator itr = h3.begin(); itr != h3.end(); itr++)
    {
        //gStyle->SetOptStat(0);

        string hname = itr->first;
        TH3* h = (TH3*)itr->second->Clone();
        h->Scale(1.0/float(h->Integral()));


        TH2* h2yx = (TH2*)h->Project3D("yx")->Clone();
        TH2* h2zx = (TH2*)h->Project3D("zx")->Clone();
        TH2* h2zy = (TH2*)h->Project3D("zy")->Clone();
       // TH1* h1x = (TH2*)h->Project3D("x")->Clone();
       // TH1* h1y = (TH2*)h->Project3D("y")->Clone();
       // TH1* h1z = (TH2*)h->Project3D("z")->Clone();
       // TH1* h1E = (TH2*)h->Project3D("energy")->Clone();

        c[0]->cd();
        h2yx->GetXaxis()->SetTitle("x (mm)");
        h2yx->GetYaxis()->SetTitle("y (mm)");
        h2yx->SetStats(1);
        TPaveText* statsBox = new TPaveText(0.7, 0.5, 0.9, 0.9, "NDC");
	statsBox->SetFillColor(0);
	statsBox->SetTextAlign(12);
	statsBox->SetTextSize(0.03);
	statsBox->AddText(Form("Entries: %.2e", static_cast<Double_t>(h2yx->GetEntries())));
	//statsBox->AddText(Form("Integral: %.2e", static_cast<Double_t>(hist3->Integral())));
	statsBox->AddText(Form("Mean: %.2f", h2yx->GetMean()));
	statsBox->AddText(Form("RMS: %.2f", h2yx->GetRMS()));
	statsBox->AddText(Form("Minimum: %.2f", h2yx->GetMinimum()));
	statsBox->AddText(Form("Maximum: %.2f", h2yx->GetMaximum()));
        gPad->SetLogx(0); gPad->SetLogy(0); gPad->SetLogz(0);


       h2yx->Draw("colz");

        //ss.str(""); ss << "test2D_yx_" << hname << ".png";
        //c->SaveAs(TString(ss.str()));

        c[1]->cd();
        h2zx->GetXaxis()->SetTitle("x (mm)");
        h2zx->GetYaxis()->SetTitle("z (mm)");

        gPad->SetLogx(0); gPad->SetLogy(0); gPad->SetLogz(0);
        h2zx->Draw("colz");

        c[2]->cd();
        h2zy->GetXaxis()->SetTitle("y (mm)");
        h2zy->GetYaxis()->SetTitle("z (mm)");

        gPad->SetLogx(0); gPad->SetLogy(0); gPad->SetLogz(0);
        h2zy->Draw("colz");

      //  c[3]->cd();
      //  h1x->GetXaxis()->SetTitle("x (mm)");
      //  gPad->SetLogx(0); gPad->SetLogy(1); gPad->SetLogz(0);
      //  h1x->Draw("colz");

      //  c[4]->cd();
      //  h1y->GetXaxis()->SetTitle("y (mm)");
      //  gPad->SetLogx(0); gPad->SetLogy(1); gPad->SetLogz(0);
      //  h1y->Draw("colz");

      //  c[5]->cd();
      //  h1z->Draw("colz");
      //  h1z->GetXaxis()->SetTitle("z (mm)");
      //  h1z->GetXaxis()->SetRangeUser(0., 300);
      //  h1z->SetTitle("Energy distribution");
      //  h1z->GetYaxis()->SetTitle("E (GeV)");
      //  gPad->SetLogx(0); gPad->SetLogy(0); gPad->SetLogz(0);


    }
    // Draw Histograms
    // *************************************************************************


}