Gaussian Fit - Width parameter Range Problem

Hi,

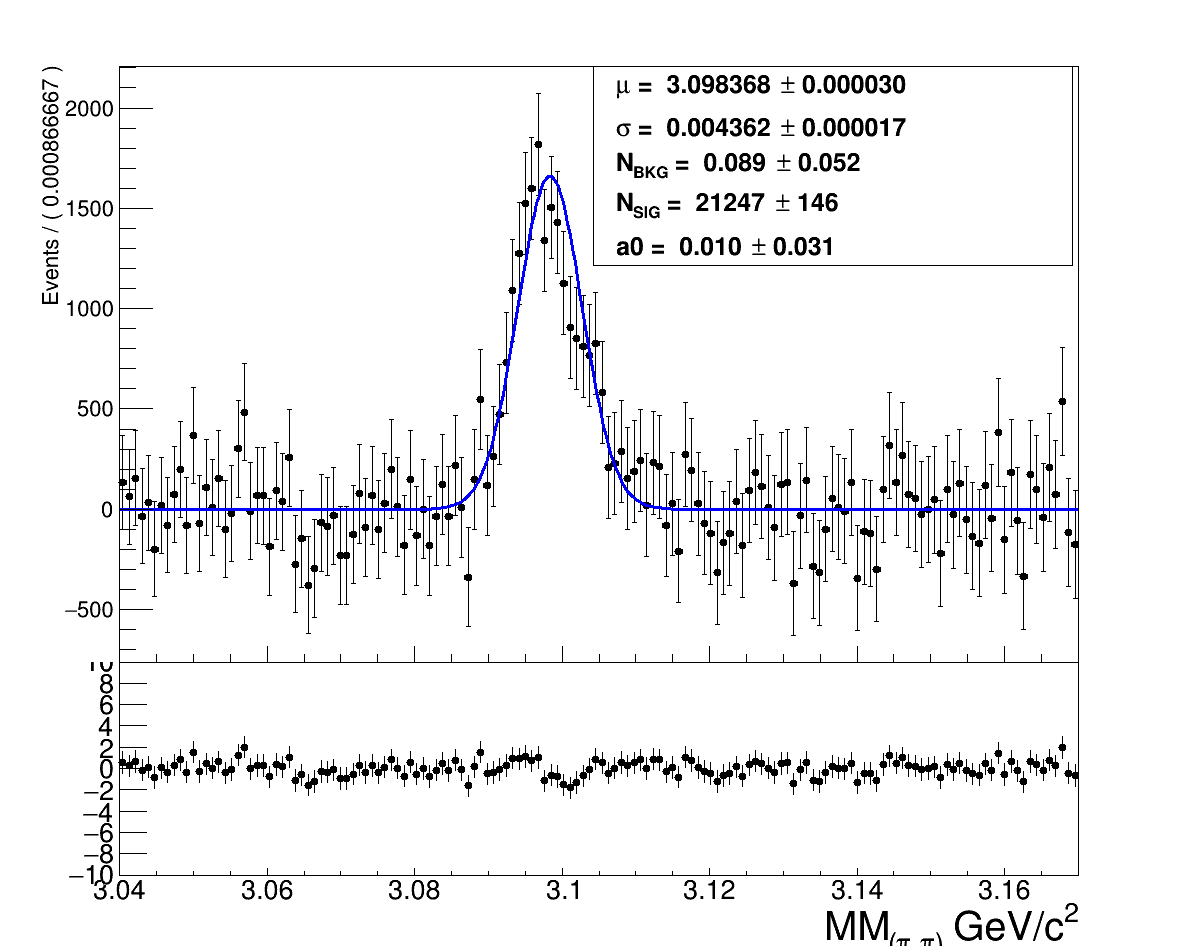
I’m trying to fit a histogram with a Gaussian ( you can find the full code and the histogram in a root file attached here ).
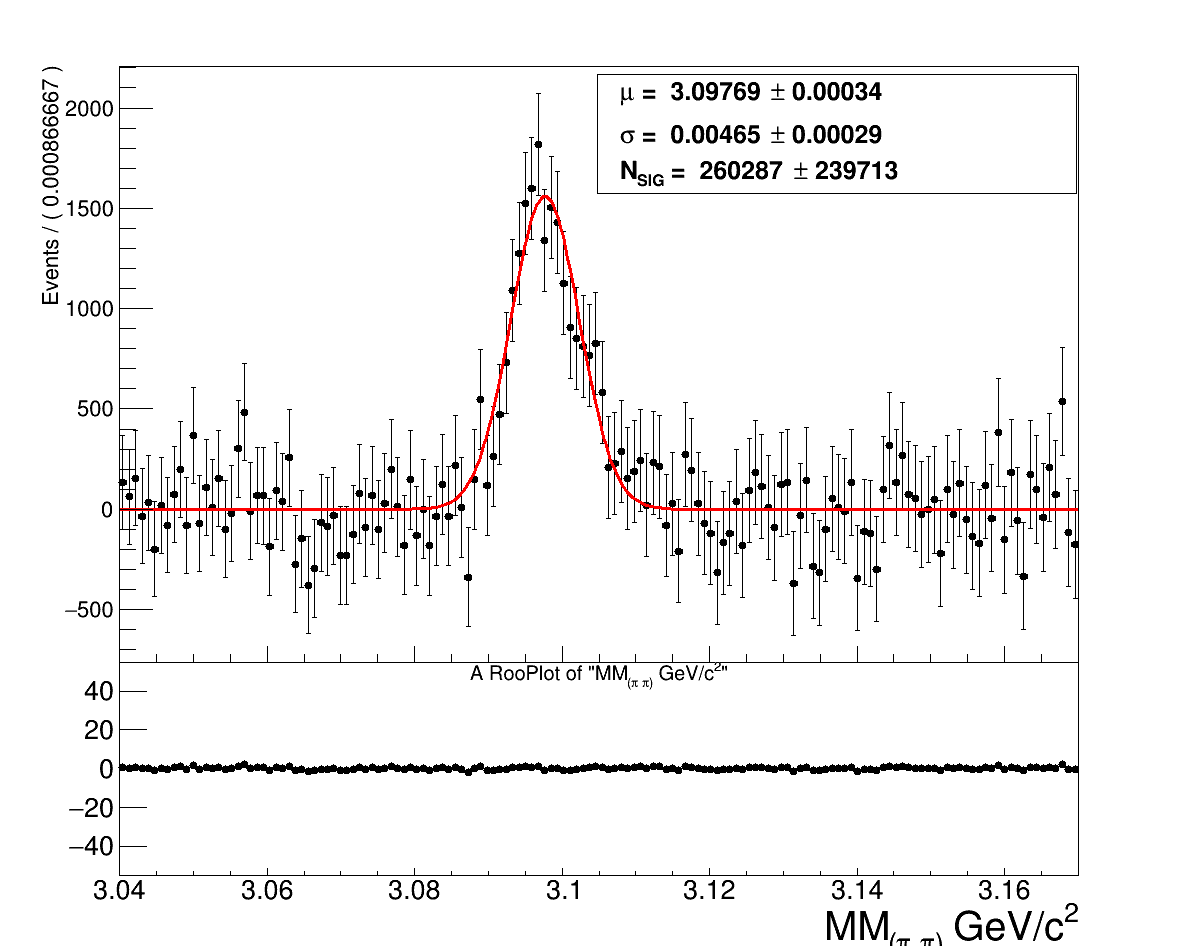
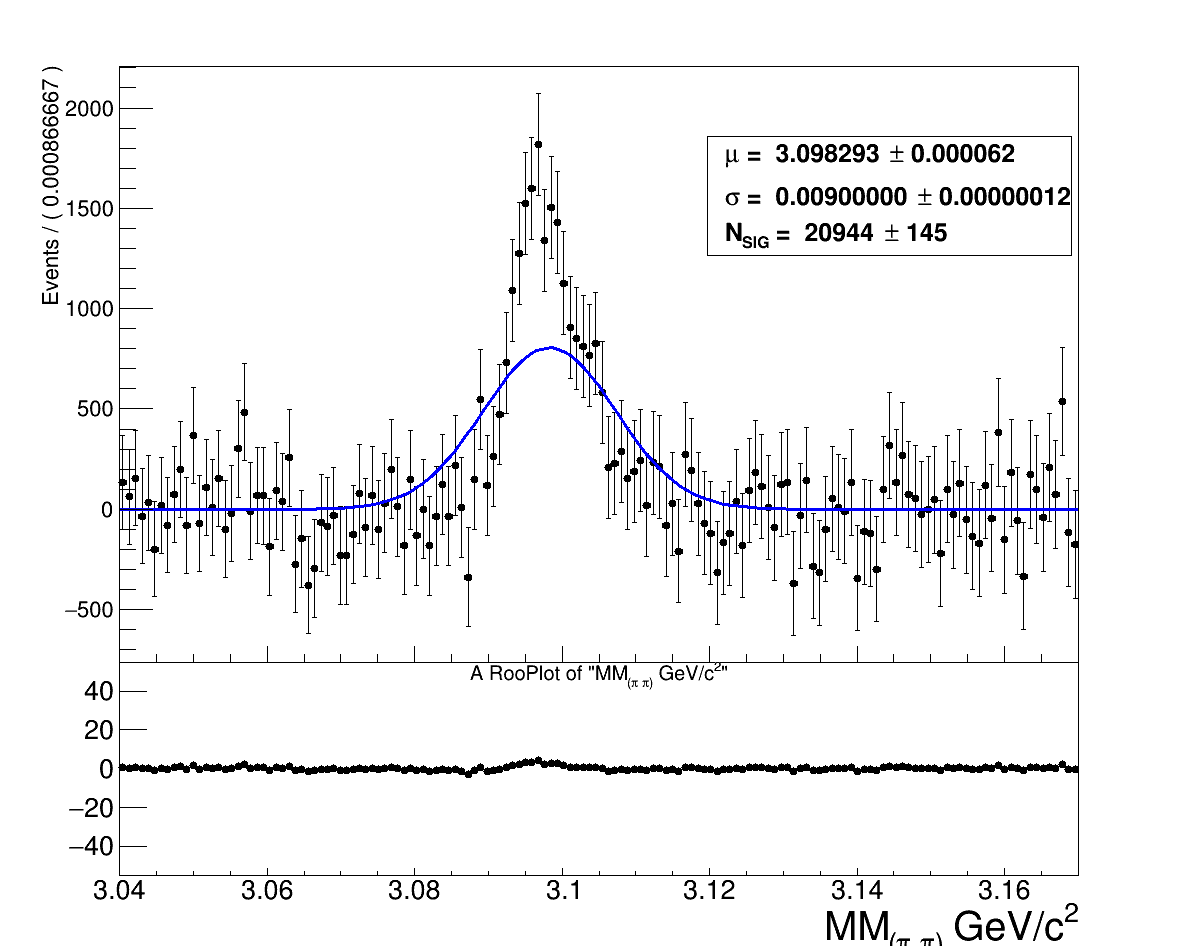
The problem is no matter what range I choose for the width, the fit takes the upper limit of the range as sigma every time.
so for example :
if the range is 0.002<sigma<0.0045 -> sigma is chosen to be 0.0045
if the range is 0.002<sigma<0.009 -> sigma is chosen to be 0.009

Could anyone please give me any idea on what I’m doing wrong or how to fix this problem ?

  TFile *f = new TFile("file4260.root");
  TH1F * h1 = new TH1F("h1","h1",150,3.04,3.17);
  h1 = (TH1F*)f.Get("h4260");

  RooRealVar x1("x1","MM_{(#pi #pi)} GeV/c^{2}",3.04,3.17) ;
  RooDataHist dh1("dh1","dataset",x1,h1);
  RooPlot* frame1 = x1.frame(Title("title")) ;
  dh1.plotOn(frame1,Name("dh1")) ;
  RooRealVar mean11("#mu","mean of gaussians",3.0965,3.0985);
  RooRealVar sigma11("#sigma","width 1 of gaussians " ,0.002,0.0045); //sigma1
//RooRealVar sigma11("#sigma","width 2 of gaussians " ,0.002,0.009); //sigma2

  RooGaussian sig11("sig11", "sig11", x1, mean11, sigma11);

  RooRealVar nsig1("N_{SIG}","signal events",0,1000000);

  RooAddPdf all1("all1","model",RooArgList(sig11),RooArgList(nsig1));

  RooFitResult* r1 = all1.fitTo(dh1,Extended(kTRUE),Save()) ;
  all1.paramOn(frame1,Layout(0.5,0.90,0.55));
  all1.plotOn(frame1,Name("all1"));
  all1.plotOn(frame1);
   r1->Print();

  RooPlot *residual1= x1.frame();
  RooHist *resHist1 = (RooHist*)frame1->pullHist();
  residual1->addObject(resHist1,"PZ");
  residual1->SetMinimum(-55.);
  residual1->SetMaximum(+55.);
  residual1->GetXaxis()->SetLabelSize(0.1);
  residual1->GetXaxis()->SetTitleOffset(0.8);
  residual1->GetXaxis()->SetTitleSize(0.15);
  residual1->GetYaxis()->SetLabelSize(0.1);
  residual1->GetYaxis()->SetNdivisions(110);

  TCanvas *c1 = new TCanvas("c1","Jpsi",1200,1200);
  c1->Divide(2);
  c1->GetPad(1)->SetPad(0.,0.3,1.,1.);
  c1->GetPad(2)->SetPad(0.,0.,1.,0.3);
  c1->GetPad(1)->SetBottomMargin(0);
  c1->GetPad(2)->SetTopMargin(0);
  c1->GetPad(2)->SetBottomMargin(0.25);
  c1->GetPad(2)->SetFillColor(4000);
  c1->cd(1);
  r1->Draw();
  frame1->Draw();
  c1->cd(2);
  residual1->Draw();


file4260.root (4.9 KB)

Try renormalizing. You have N_sig = 20944, while sigma = 0.009. These are very different so you can have imprecisions in your fit due to the numerical derivatives. If you multiply things such that N is close to 1, you’ll probably get better results. Alternatively, try using MeV/c² for your x-axis.

1 Like

Hi,

@amadio’s comment is already a good start. Further, you should not be required to force sigma into a certain range. I suspect that the problem is in the background parts. There might be a tension in the tails of the Gaussian and the flat line.
Try adding a background model (an offset or a polynomial of 1st degree), and add it to the model as second argument of the RooAddPdf.

1 Like

Hi @SimN,
Does the like imply that it’s working now?

Hi @StephanH,

Two approaches helped to improve the fit (pictures attached) :
First one was adding the polynomial to the Gaussian which you suggested.
Second one was doing the fits with a chi square method instead of a likelihood method.
(when trying to fit with Root, I had the same problem, the likelihood method did not work and the chisquare worked perfectly).
The problem is that with the Chisquare fit is that N_sig is way bigger with this approach and error_Nsig is huge.

My code for the chisquare fit :

  TFile *f = new TFile("file4260.root");
  TH1F * h1 = new TH1F("h1","h1",150,3.04,3.17);
  h1 = (TH1F*)f->Get("h4260");

  RooRealVar x1("x1","MM_{(#pi #pi)} GeV/c^{2}",3.04,3.17) ;
  RooDataHist dh1("dh1","dataset",x1,h1);
  RooPlot* frame1 = x1.frame(Title("title")) ;
  dh1.plotOn(frame1,Name("dh1")) ;
  RooRealVar mean11("#mu","mean of gaussians",3.0965,3.0985);
  RooRealVar sigma11("#sigma","width of gaussians",0.002,0.25);

  RooGaussian sig11("sig11", "sig11", x1, mean11, sigma11);
  RooRealVar nsig1("N_{SIG}","signal events",0,1000000);

  RooAddPdf sig("sig","Signal",RooArgList(sig11),nsig1) ;
  RooChi2Var chi2("chi2","chi2",sig,dh1,RooAbsData::Poisson) ;
 RooMinuit m(chi2) ;
  m.migrad();
  m.hesse();
  RooFitResult* r1 = m.save();
  sig.plotOn(frame1,LineColor(kRed)) ;
  sig.paramOn(frame1,Layout(0.5,0.90,0.55));
  r1->Print();

  RooPlot *residual1= x1.frame();
  RooHist *resHist1 = (RooHist*)frame1->pullHist();
  residual1->addObject(resHist1,"PZ");
  residual1->SetMinimum(-55.);
  residual1->SetMaximum(+55.);
  residual1->GetXaxis()->SetLabelSize(0.1);
  residual1->GetXaxis()->SetTitleOffset(0.8);
  residual1->GetXaxis()->SetTitleSize(0.15);
  residual1->GetYaxis()->SetLabelSize(0.1);
  residual1->GetYaxis()->SetNdivisions(110);

  TCanvas *c1 = new TCanvas("c1","Jpsi",1200,1200);
  c1->Divide(2);
  c1->GetPad(1)->SetPad(0.,0.3,1.,1.);
  c1->GetPad(2)->SetPad(0.,0.,1.,0.3);
  c1->GetPad(1)->SetBottomMargin(0);
  c1->GetPad(2)->SetTopMargin(0);
  c1->GetPad(2)->SetBottomMargin(0.25);
  c1->GetPad(2)->SetFillColor(4000);
  c1->cd(1);
  r1->Draw();
  frame1->Draw();
  c1->cd(2);
  residual1->Draw();

This topic was automatically closed 14 days after the last reply. New replies are no longer allowed.