Function to fit data point

Dear expert,

I have 20 data points having the below shape. I have tried to fit these points with a linear function.
image

But it seems the linear function is not describing these data points.
Can you please suggest which function I should use?

Regards
Chanchal

Hi Chanchal,

To me the fit itself looks not that bad - but the data points don’t fully follow a linear trend. If you are interested in the goodness of your fit, you can look at chi^2/NDF (number of degrees of freedom), which should be around 1 if the data is well-described by the fit.

In general, fitting cannot tell you the distribution of the data. That’s what you need to provide as an input (e.g. linear, polynomial, gauss, etc.). Given the distribution, fitting will find good parameters of the fit function such that it matches the data points.

Cheers,
Jakob

Hi @jblomer,

Yes. I have checked the chi^2/ndf = ~3.7 for the linear function.
I have also tried to fit these data points with the four-order polynomial function but chi^2/ndf = ~2.6 is still high.
image
image

This is the code that I am using (in case you refer):
plots.C (2.6 KB)

Is there any function to better describe these data points?

Regards
Chanchal

Hi Chanchal,

While higher-order polynomials have a better chance following the data points, the question is what would such a fit mean. The fit function should be given by the theory of the process you measure. You can then use the fit to extract the free parameters. For instance, if you measure something that should behave as a line, you can use the fit to extract the offset and the slope from the measured data points.

Cheers,
Jakob

Hi Chanchal,

you can get chi^2/ndf = 18/14 with a “line - sin/x” function,
see the macro
fitOscillation.C (2.8 KB)

Cheers,
Smbat

Hii @smgrig, @jblomer,

Thanks a lot, it seems better now.

Regards
Chanchal

Hii @smgrig, @jblomer,

One more question, Is there any way to fit the data point of a graph range-wise?
For example, can we split the range of this graph into 3 pieces and fit with three different functions simultaneously?

Regards
Chanchal

Perhaps @moneta can comment on range-wise fitting

Hi Chanchal,

yes, it’s totally possible, see Chapter: FittingHistograms

Hii @yus,

This is in the histogram. I want to do the same with graphs.
I have tried like this but it’s not working.

Here is code that I am using:
fit.C (2.4 KB)

Regards
Chanchal

Try this instead:

void fit()

{
  TCanvas *c1 = new TCanvas("c1","c1",700,500);
  Int_t n = 20;

  // mu_Errm
  Double_t x[20] = {0.002723, 0.003313, 0.003625, 0.003854, 0.004033, 0.004178, 0.004296, 0.004406, 0.00451, 0.004618, 0.004739, 0.0048
73, 0.005035, 0.005227, 0.005451, 0.005723, 0.006051, 0.006504, 0.007195, 0.008657 };
  Double_t ex[20] = {7.95421e-06, 3.22325e-06, 2.15406e-06, 1.68393e-06, 1.34469e-06, 1.06632e-06, 9.06832e-07, 8.99227e-07, 8.64925e-0
7, 9.82474e-07, 1.02539e-06, 1.21688e-06, 1.44946e-06, 1.70204e-06, 2.06965e-06, 2.45717e-06, 3.07269e-06, 4.33906e-06, 7.71312e-06, 2.
26849e-05};


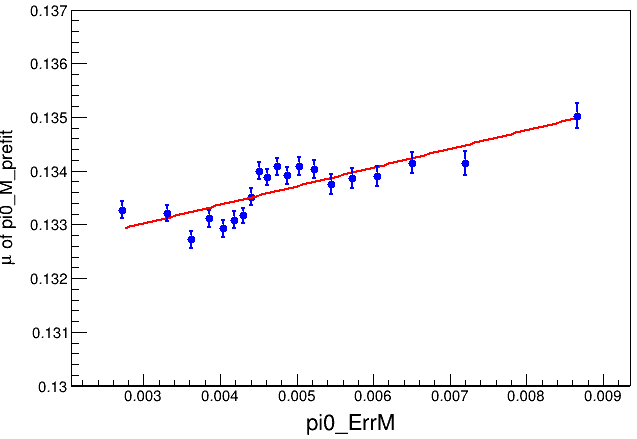
  Double_t y[20] = {0.13327, 0.13322, 0.13272, 0.13311, 0.13293, 0.13309, 0.13317, 0.13351, 0.13400, 0.13389, 0.13408, 0.13392, 0.13408
, 0.13403, 0.13376, 0.13387, 0.13390, 0.13415, 0.13414, 0.13502};
  Double_t ey[20] ={0.00016, 0.00015, 0.00016, 0.00016, 0.00016, 0.00016, 0.00014, 0.00016, 0.00016, 0.00015, 0.00016, 0.00016, 0.00017
, 0.00017, 0.00018, 0.00019, 0.00019, 0.00020, 0.00023, 0.00023};


  // TGraph
  TGraph *gr1 = new TGraphErrors(n,x,y,ex,ey);
  gr1->SetMarkerStyle(20);
  gr1->SetMarkerColor(kBlue);
  gr1->SetDrawOption("P");
  gr1->SetLineColor(4);
  gr1->SetLineWidth(2);
  gr1->GetXaxis()->SetRangeUser(0,0.015);
  gr1->GetYaxis()->SetRangeUser(0.130,0.137);
  gr1->GetXaxis()->SetTitle("pi0_ErrM");
  gr1->GetYaxis()->SetTitle("#mu of pi0_M_prefit");
  gr1->GetXaxis()->CenterTitle();
  gr1->GetYaxis()->CenterTitle();
  gr1->GetXaxis()->SetTitleSize(0.05);
  gr1->GetYaxis()->SetTitleSize(0.04);
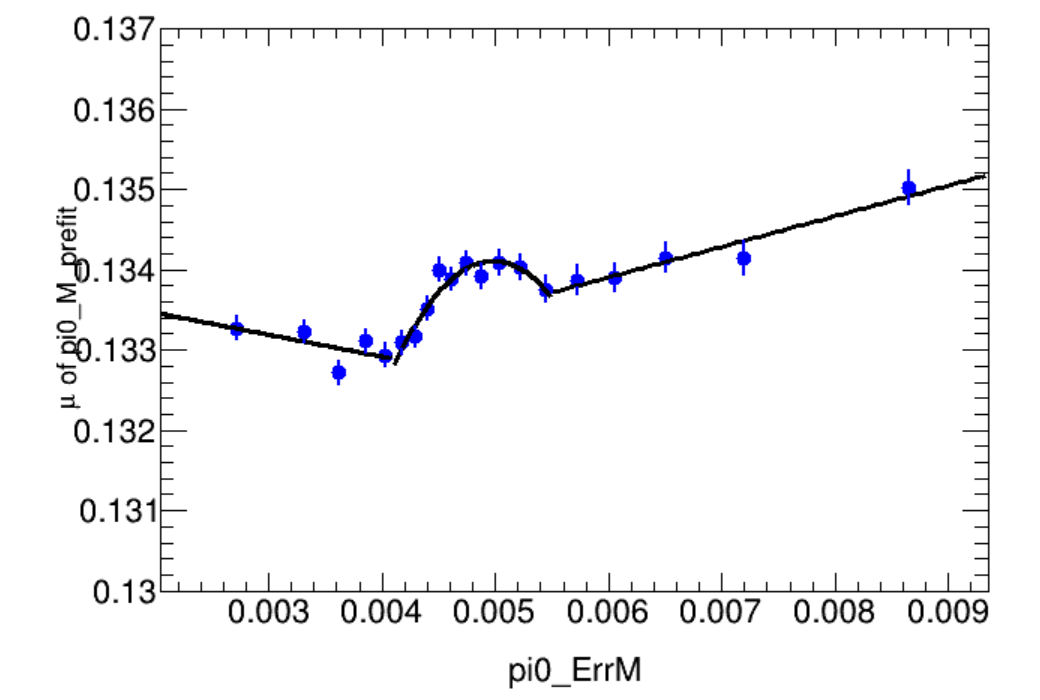


  // Range wise fit
  gr1->Sort(); // make sure points are in the "increasing order in x"
  Double_t par[7];

  // 0 to 0.004
  Double_t xmin1 = 0,  xmax1 = 0.0041;
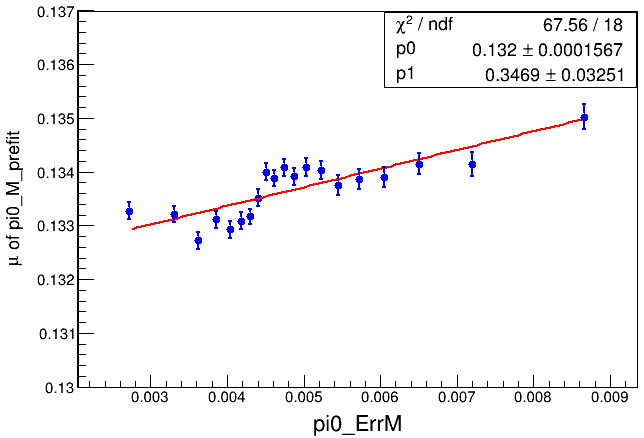
  TF1 *f1 = new TF1("f1","pol1", xmin1, xmax1);

   // 0.004 to 0.0055
  Double_t xmin2 = 0.0041,  xmax2 = 0.0055;
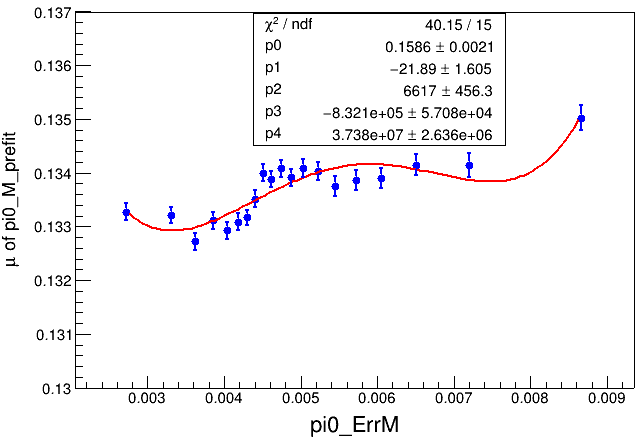
  TF1 *f2 = new TF1("f2","pol2", xmin2, xmax2);

   // 0.0055 to 0.015
  Double_t xmin3 = 0.0055,  xmax3 = 0.015;
  TF1 *f3 = new TF1("f3","pol1", xmin3, xmax3);

  TF1 *total = new TF1("total","pol1(0)+pol2(2)+pol1(5)",0,0.015);

  gr1->Fit("f1", "R");
  gr1->Fit("f2", "R+");
  gr1->Fit("f3", "R+");

  f1->GetParameters(&par[0]);
  f2->GetParameters(&par[2]);
  f3->GetParameters(&par[5]);
  total->SetParameters(par);
//  gr1->Fit("total","R+");

  gr1->Draw("AP");


  c1->Update();
  //c1->GetFrame()->SetFillColor(21);
  c1->GetFrame()->SetBorderSize(12);
  c1->Modified();


}

It gives me this:

Hii @yus,

Thanks a lot.

Regards
Chanchal

This topic was automatically closed 14 days after the last reply. New replies are no longer allowed.