Hi,
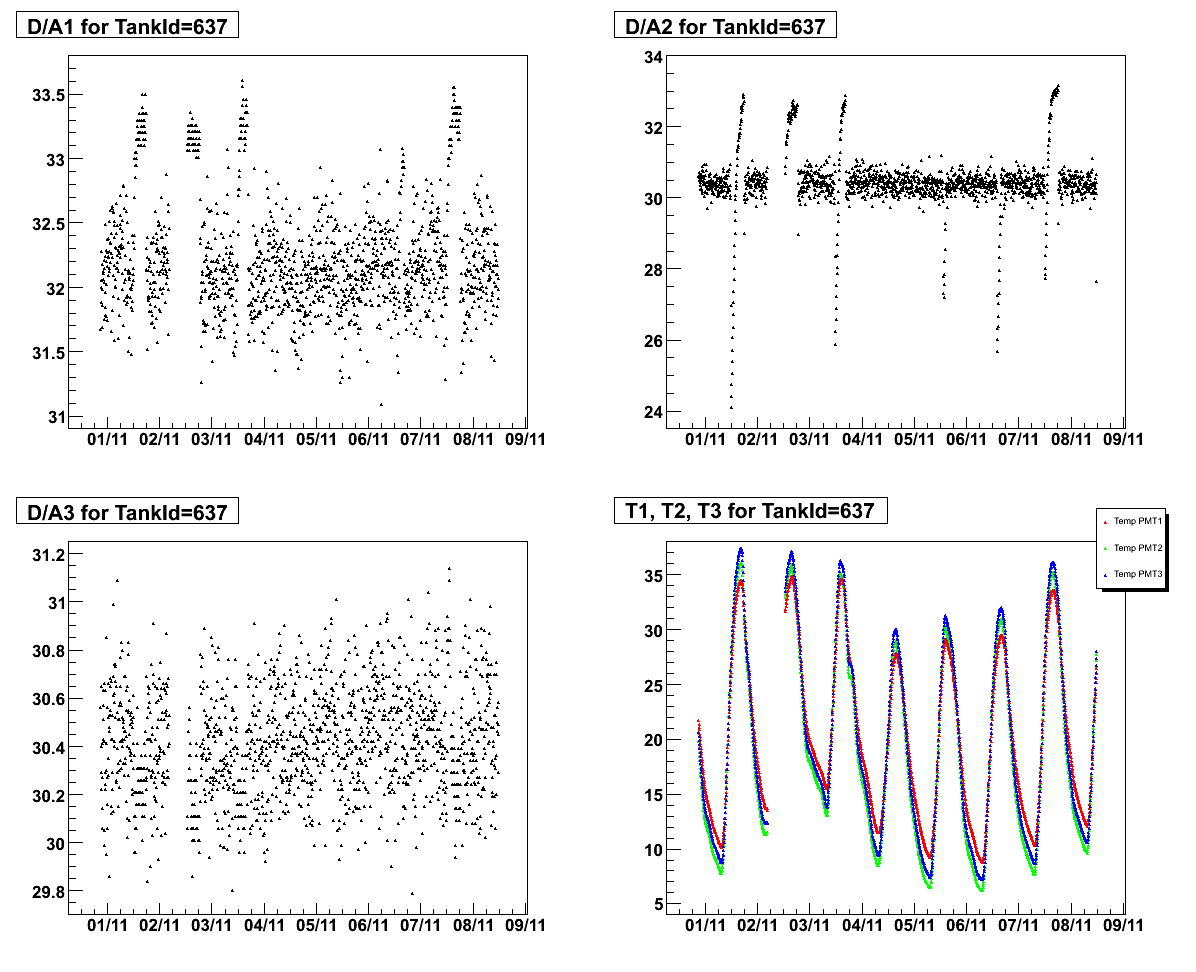
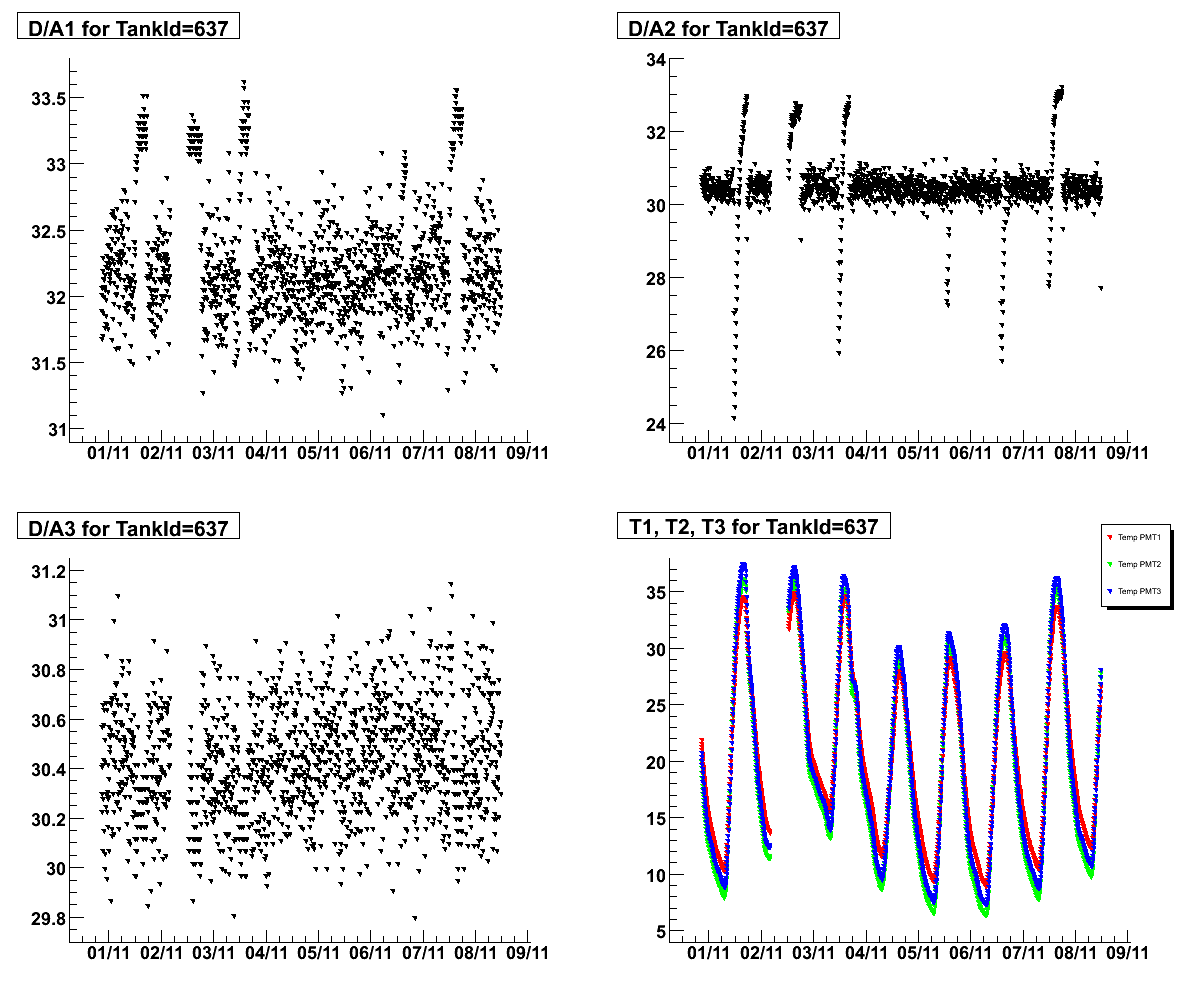
I wrote a macro to make some plots, and I found that after I compile it, the images generated with compiled version have certain differences. The compiled version make the images with bigger markers, and without the frame line for the pads.
The strange thing is that when I do c1->Print(“file.png”,".png") under Root, it generates the same plot than the Canvas. So it is some issue happening only for the compiled version.
I attached both images.
Do you know how to avoid these differences? Or a way to draw the line of the frame? I tried adding some code to change the frame line color and width, but without success (commented lines in the code).
This is the part of the code that generates the plot:
TCanvas *c1 = new TCanvas(“c1”,“c1”,1200,1000);
c1->Divide(2,2);
c1->cd(1);
Archive->SetMarkerSize(0.4);
Archive->Draw(“fDynodeAnode0:(fTime-788929200)”,int var),tankidchar,"");
TH1F h1 = (TH1F)Archive->GetHistogram();
h1->GetXaxis()->SetTimeDisplay(1);
h1->GetXaxis()->SetTimeFormat("%d/%m");
sprintf(titlechar,“D/A1 for TankId=%d”,tankid);
h1->SetTitle(titlechar);
//TPad pad1 = (TPad)c1->GetPad(1);
//TFrame frame1 = (TFrame)c1->GetFrame();
//frame1->SetLineWidth(2);
//frame1->SetLineColor(kBlack);
c1->cd(2);
Archive->Draw(“fDynodeAnode1:(fTime-788929200)”,tankidchar,"");
TH1F h2 = (TH1F)Archive->GetHistogram();
h2->GetXaxis()->SetTimeDisplay(1);
h2->GetXaxis()->SetTimeFormat("%d/%m");
sprintf(titlechar,“D/A2 for TankId=%d”,tankid);
h2->SetTitle(titlechar);
c1->cd(3);
Archive->Draw(“fDynodeAnode2:(fTime-788929200)”,tankidchar,"");
TH1F h3 = (TH1F)Archive->GetHistogram();
h3->GetXaxis()->SetTimeDisplay(1);
h3->GetXaxis()->SetTimeFormat("%d/%m");
sprintf(titlechar,“D/A3 for TankId=%d”,tankid);
h3->SetTitle(titlechar);
c1->cd(4);
Archive->SetMarkerColor(kGreen);
Archive->Draw(“fPMT1:(fTime-788929200)”,tankidchar,"");
TH1F h7 = (TH1F)Archive->GetHistogram();
h7->GetXaxis()->SetTimeDisplay(1);
h7->GetXaxis()->SetTimeFormat("%d/%m");
sprintf(titlechar,“T1, T2, T3 for TankId=%d”,tankid);
h7->SetTitle(titlechar);
Archive->SetMarkerColor(kRed);
Archive->Draw(“fPMT0:(fTime-788929200)”,tankidchar,“same”);
TH1F h20 = (TH1F)Archive->GetHistogram();
Archive->SetMarkerColor(kBlue);
Archive->Draw(“fPMT2:(fTime-788929200)”,tankidchar,“same”);
TH1F h21 = (TH1F)Archive->GetHistogram();
Archive->SetMarkerColor(kBlack);
TLegend *leg = new TLegend(0.85,0.8,.97,.97);
leg->SetFillColor(kWhite);
leg->AddEntry(h20,“Temp PMT1”,“p”);
leg->AddEntry(h7,“Temp PMT2”,“p”);
leg->AddEntry(h21,“Temp PMT3”,“p”);
leg->Draw();
#ifndef CINT
sprintf(pngaddress,"./plots/%d_DA_%s.png",tankid,rootfile);
c1->Print(pngaddress,“png”);
c1->Close();
c1->Clear();
#else