void alpha_0_beta_and_C01(){
// gROOT->SetStyle("Plain");
gStyle->SetOptFit(1111);
auto c1= new TCanvas("c","BPRE",10,10,600,600);
c1->Divide(1,1);
c1->SetTickx();
c1->SetTicky();
c1->SetTitle("");
c1->SetLineWidth(3);
c1->SetBottomMargin(0.1);
c1->SetTopMargin(0.05);
c1->SetRightMargin(0.01);
c1->SetFillColor(0);
c1->cd(0);
TPad* pad1 = new TPad("pad1","pad1",0,0.3,1,0.97);
pad1->SetBottomMargin(0);
pad1->SetLeftMargin(0.13);
pad1->SetRightMargin(0.04);
pad1->SetTopMargin(0.02);
pad1->SetGrid();
pad1->Draw();
pad1->cd();
TH1F* h=pad1->DrawFrame(0,-5,360,200);
h->GetXaxis()->SetRangeUser(0,360);
auto hh=new TH1F("Statistics" , "" ,36,0.,360.);
hh->SetMarkerStyle(8);
ifstream inp; double x;
inp.open("dummy1.txt");
while(!(inp >> x)==0){hh->Fill(x);}
auto graph = new TGraphErrors("./alpha_0_beta_and_C01.txt","%lg %lg %lg %lg");
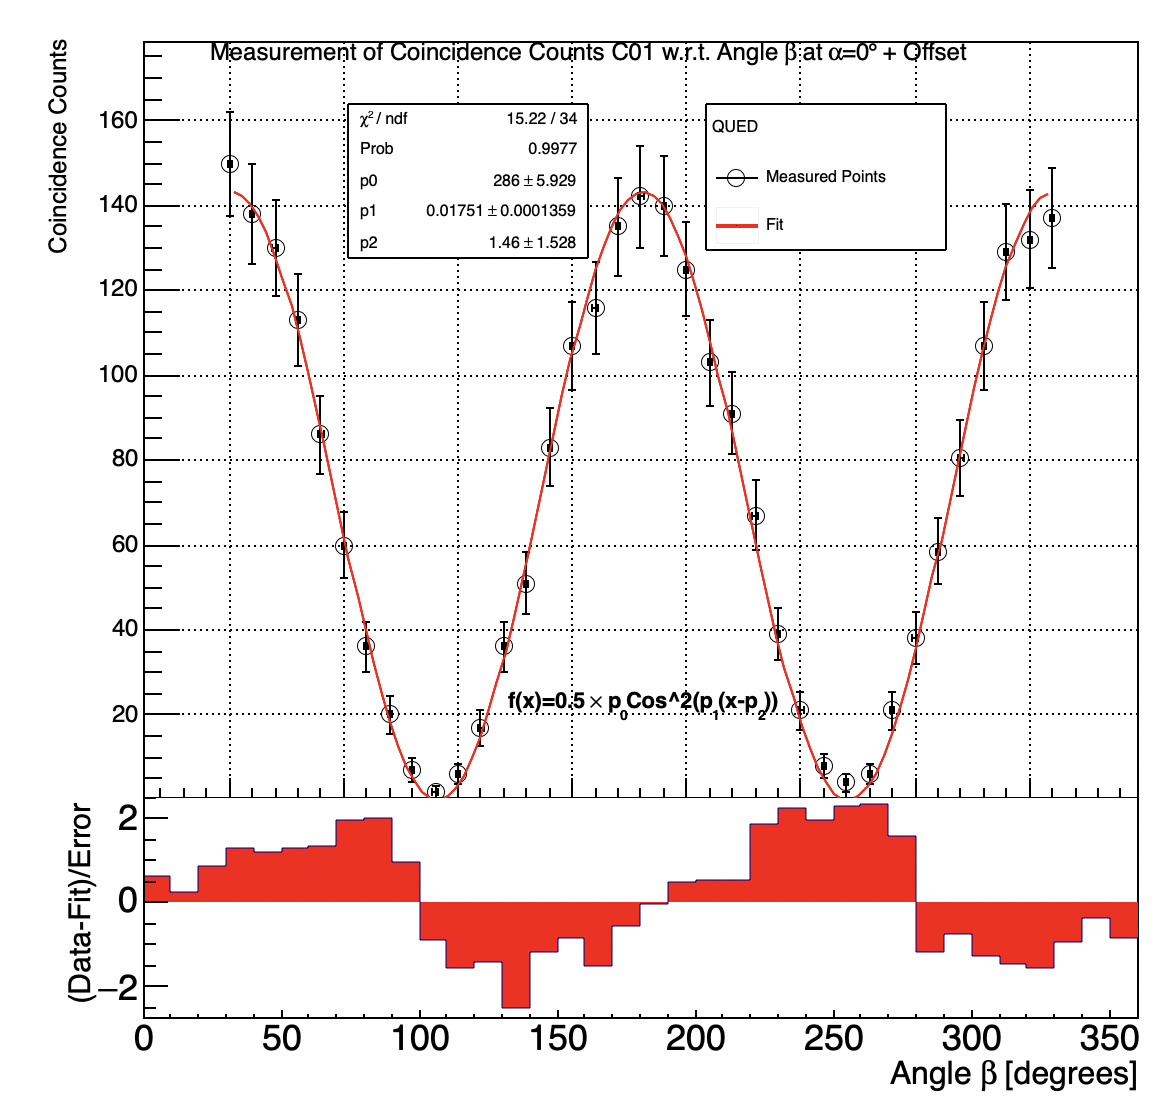
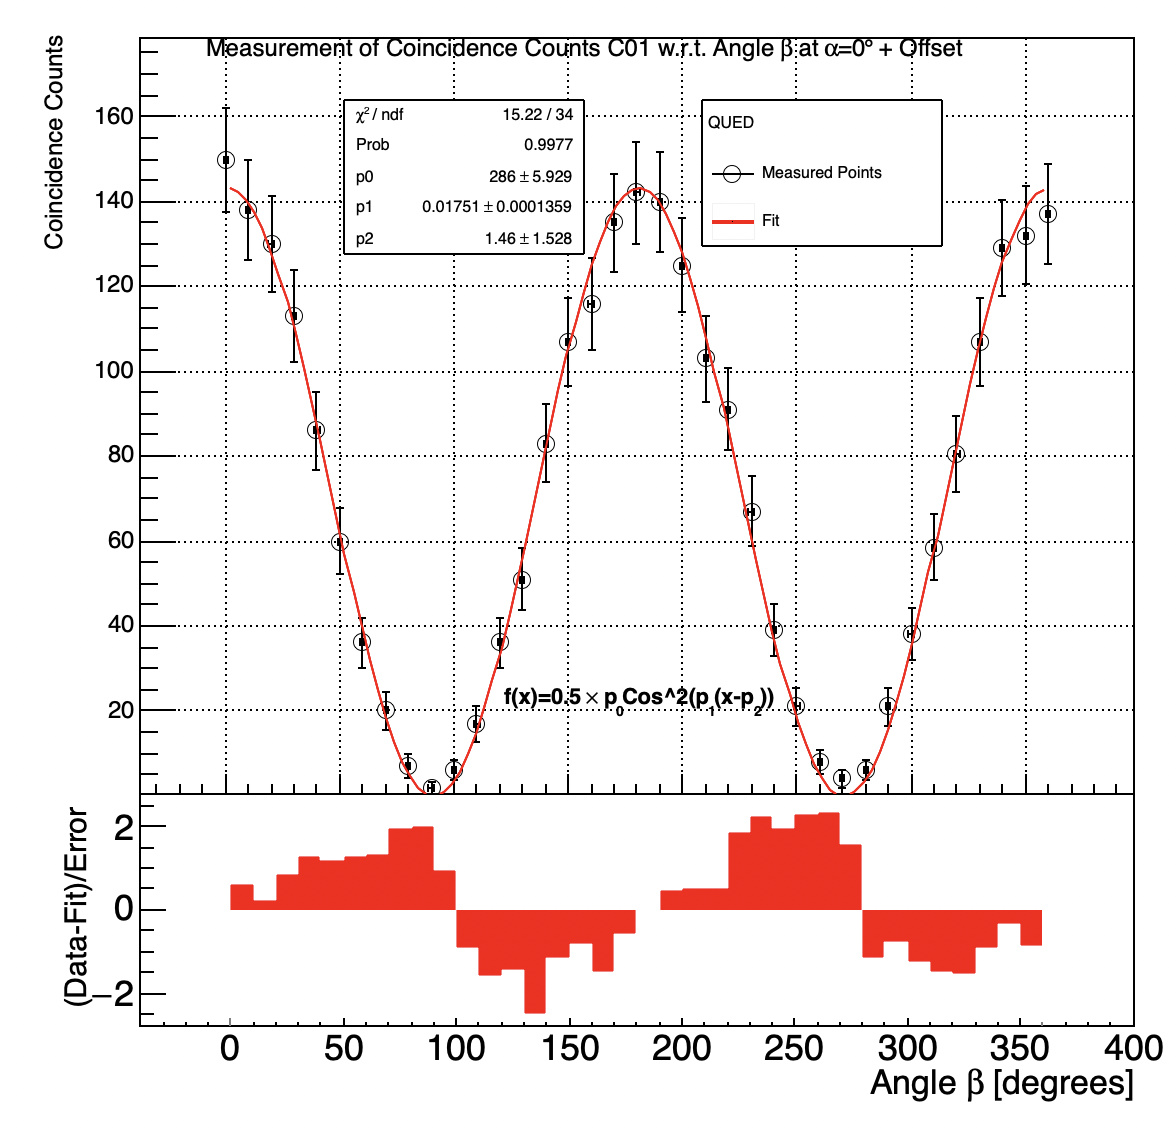
graph->SetTitle("Measurement of Coincidence Counts C01 w.r.t. Angle #beta at #alpha=0#circ + Offset; Angle #beta [degrees]; Coincidence Counts");
graph->SetMarkerStyle(kCircle);
graph->SetFillColor(0);
graph->GetYaxis()->SetTitleOffset(1.3);
graph->Draw("PEA");
auto g = new TF1("Sinusoidal Fit","(0.5*[0]*((TMath::Cos([1]*(x-[2]))**2)))",0.,360.);
g->SetParameters(320.0,0.02,5);
g->SetLineColor(kRed);
graph->Fit(g,"M","",0.,360.); // graph.Fit(g,"M","SAMES",0.,10.);
g->Draw("same");
// Draw the Legend
auto leg = new TLegend(0.6,0.71,0.8,0.9,"QUED");
leg->SetFillColor(0);
leg->AddEntry(graph,"Measured Points");
leg->AddEntry(g,"Fit");
leg->Draw(); // leg.DrawClone("Same");
gStyle->SetOptFit(1111); // Not working...
auto text = new TLatex(121.4399,21.4941,"f(x)=0.5 #times p_{0}Cos^2(p_{1}(x-p_{2}))");
text->SetTextSize(0.03114861);
text->Draw();
gPad->Update();
TPaveStats *ps = (TPaveStats*)graph->GetListOfFunctions()->FindObject("stats");
ps->SetX1NDC(0.3);
ps->SetY1NDC(0.7);
ps->SetX2NDC(0.5);
ps->SetY2NDC(0.9);
gPad->Modified();
gPad->Update();
TH1F *DiffHist = new TH1F(*(hh));
DiffHist->SetFillColor(2);
DiffHist->SetLineColor(0);
for ( int i = 1; i <= DiffHist->GetNbinsX(); i++ ) {
DiffHist->SetBinContent(i,(hh->GetBinContent(i) -
g->Eval(hh->GetBinCenter(i)))/(hh->GetBinError(i)));
}
c1->cd(0);
TPad* pad2 = new TPad("pad2","pad2",0,0.01,1,0.3);
pad2->SetLeftMargin(0.13);
pad2->SetRightMargin(0.04);
pad2->SetTopMargin(0);
pad2->SetBottomMargin(0.3);
pad2->Draw();
pad2->cd();
TH1F *frame = pad2->DrawFrame(-40.,-2.8,400.,2.8);
TAxis* ay = frame->GetYaxis();
TAxis* ax = frame->GetXaxis();
ay->SetTitle("(Data-Fit)/Error");
ay->CenterTitle(true);
ay->SetLabelFont(42);
ay->SetLabelSize(0.10);
ay->SetTitleSize(0.3);
ay->SetTitleOffset(0.33);
ay->SetNdivisions(505);
ay->SetLabelSize(0.12);
ay->SetTitleSize(0.1);
ax->SetTitle("Angle #beta [degrees]");
ax->SetLabelFont(42);
ay->SetLabelFont(42);
ax->SetLabelSize(0.12);
ax->SetTitleSize(0.11);
gStyle->SetOptStat(0);
DiffHist->Draw("SAME");
}