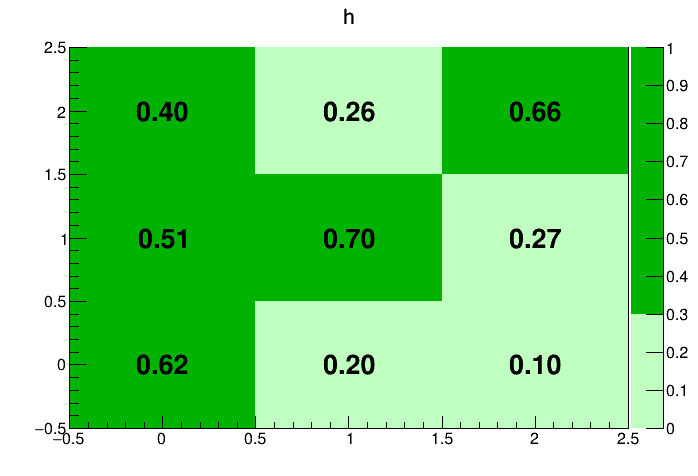
Consider this example:
const unsigned char n = 3;
Int_t colours[n] = {kGreen -10, kGreen -6, kGreen + 1};
gStyle -> SetPalette(n, colours);
gStyle -> SetPaintTextFormat("2.2f");
gStyle -> SetOptStat(0);
TH2 * h = new TH2F("h", "h", 3, -0.5, 2.5, 3, -0.5, 2.5);
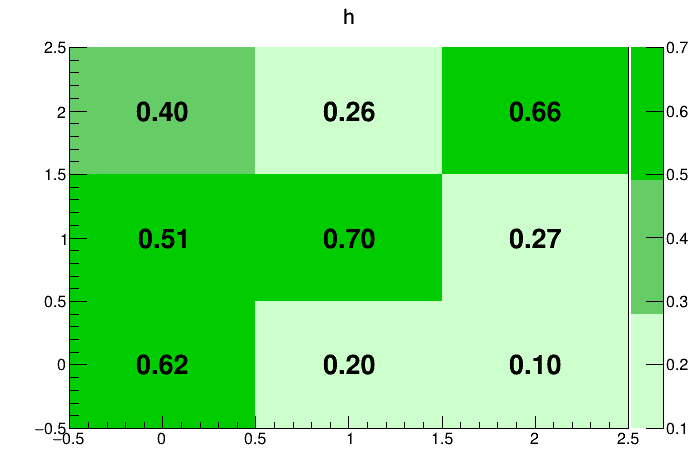
h -> Fill(0.0, 0.0, 0.62);
h -> Fill(0.0, 1.0, 0.51);
h -> Fill(0.0, 2.0, 0.4);
h -> Fill(1.0, 0.0, 0.2);
h -> Fill(1.0, 1.0, 0.7);
h -> Fill(1.0, 2.0, 0.26);
h -> Fill(2.0, 0.0, 0.1);
h -> Fill(2.0, 1.0, 0.27);
h -> Fill(2.0, 2.0, 0.66);
TCanvas * c = new TCanvas;
h -> Draw("COLZTEXT");
h -> SetMarkerSize(3.0);
The output is:
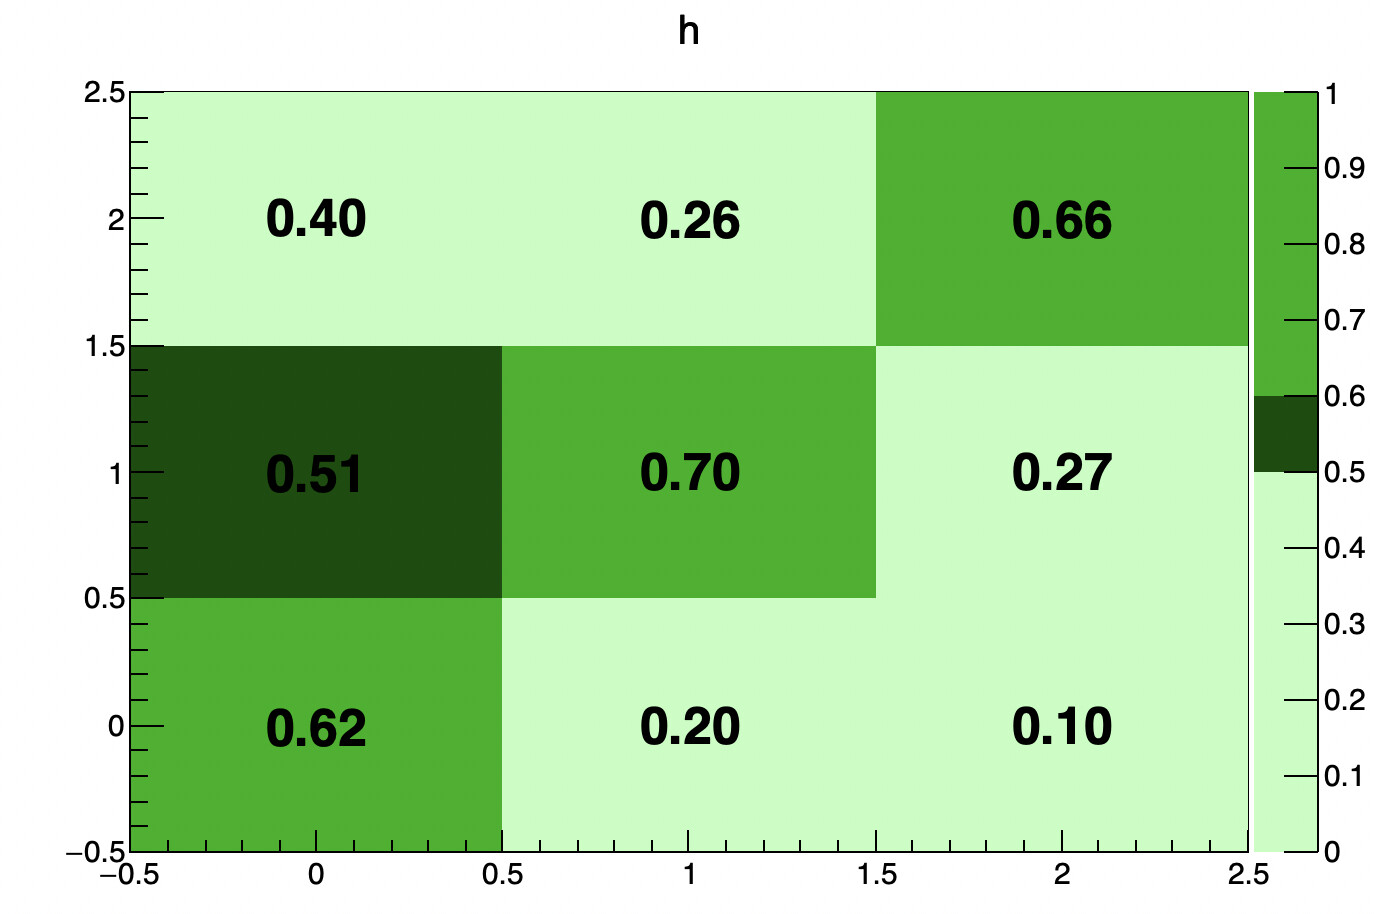
I would like to change the colour palette in the following way:
light green applies to values [ 0.0; 0.5 )
medium green - [ 0.5; 0.6 )
dark green - [0.6; 1.0001]
(the values define important thresholds).
How could I adjust the colour palette in this manner.