Root experts
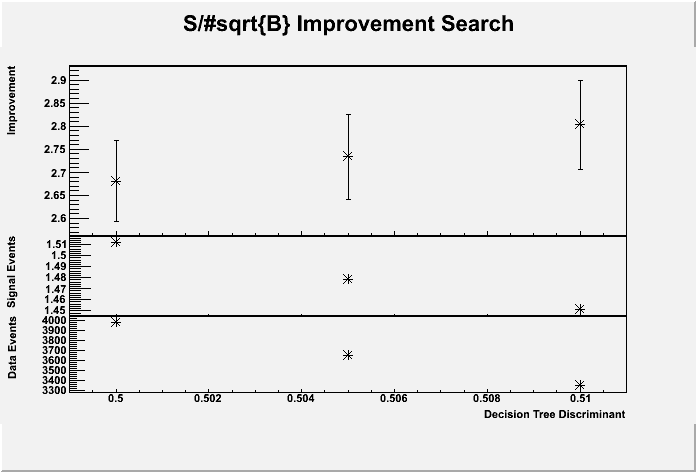
I was trying to reproduce a plot that I had done in gnuplot in root. It is pretty basic. Three plots stacked on top of each other sharing a common x-axis. The problem I am having is related to the font sizes. I would like to know how to make the fonts all the same size and legible. Right now the fonts are auto scaling. I have used one of the examples to get started. I have attached the current look of this plot. The function that generates this is below. Thanks for any input.
void generateImprovementPlot(vector<ScanResult> &results, string filename) {
  TCanvas *c1 = new TCanvas("c1","c1",200,10,700,500);

  double xlow      = 0.0;
  double xhigh     = 1.0;
  double imp_low   = 0.0;
  double imp_high  = 4.0;
  double sig_low   = 0.0;
  double sig_high  = 5.0;
  double dat_low   = 0.0;
  double dat_high  = 100000;

  TPad *pad1 = new TPad("pad1", "pad1", 0, 0.40, 1, 0.9);
  TPad *pad2 = new TPad("pad2", "pad2", 0, 0.20, 1, 0.40);
  TPad *pad3 = new TPad("pad3", "pad3", 0, 0.1, 1, 0.20);

  pad1->SetBottomMargin(0.0001);
  pad1->SetBorderMode(0);
  pad2->SetTopMargin(0.0001);
  pad2->SetBottomMargin(0.0001);
  pad2->SetBorderMode(0);
  pad3->SetTopMargin(0.0001);
  pad3->SetBottomMargin(0.1);
  pad3->SetBorderMode(0);
  pad1->Draw();
  pad2->Draw();
  pad3->Draw();

  int npoints = results.size();
  TGraphErrors *imp = new TGraphErrors(npoints);
  TGraphErrors *sig = new TGraphErrors(npoints);
  TGraphErrors *dat = new TGraphErrors(npoints);

  imp->SetTitle("");
  sig->SetTitle("");
  dat->SetTitle("");

  vector<ScanResult>::iterator it;
  int counter = 0;
  for(it = results.begin(); it != results.end(); it++) {
    ScanResult tmp = (*it);

    if(tmp.data_events != 0) xhigh = tmp.cutpoint;

    imp->SetPoint(counter, tmp.cutpoint, tmp.improvement);
    imp->SetPointError(counter, 0, tmp.improvement_err);

    double imphigh = tmp.improvement + tmp.improvement_err;
    double implow  = tmp.improvement - tmp.improvement_err;
    if(imphigh > imp_high) imp_high = imphigh;
    if(implow < imp_low) imp_low = implow;

    sig->SetPoint(counter, tmp.cutpoint, tmp.signal_pred_events);
    sig->SetPointError(counter, 0, 0);

    if(tmp.signal_pred_events > sig_high) sig_high = tmp.signal_pred_events;
    if(tmp.signal_pred_events < sig_low) sig_low = tmp.signal_pred_events;

    dat->SetPoint(counter, tmp.cutpoint, tmp.data_events);
    dat->SetPointError(counter, 0, 0);

    if(tmp.data_events > dat_high) dat_high = tmp.data_events;
    if(tmp.data_events < dat_low) dat_low = tmp.data_events;

    counter++;
  }

  double imp_delta = imp_high - imp_low / 8.0;
  imp_high += imp_delta;
  imp_low  -= imp_delta;

  double sig_delta = sig_high - sig_low / 8.0;
  sig_high += sig_delta;
  sig_low  -= sig_delta;

  double dat_delta = dat_high - dat_low / 8.0;
  dat_high += dat_delta;
  dat_low  -= dat_delta;

  pad1->cd();
  imp->Draw("AP*");
  imp->GetHistogram()->GetYaxis()->SetTitle("Improvement");

  pad2->cd();
  sig->Draw("AP*");
  sig->GetHistogram()->GetYaxis()->SetTitle("Signal Events");

  pad3->cd();
  dat->Draw("AP*");
  dat->GetHistogram()->GetXaxis()->SetTitle("Decision Tree Discriminant");
  dat->GetHistogram()->GetYaxis()->SetTitle("Data Events");

  c1->cd();

  TText *thetitle = new TText;
  thetitle->SetTextAlign(22);
  thetitle->DrawTextNDC(0.5, 0.95, "S/#sqrt{B} Improvement Search");

  c1->SaveAs("test.eps");
}
Justace

