Hello,
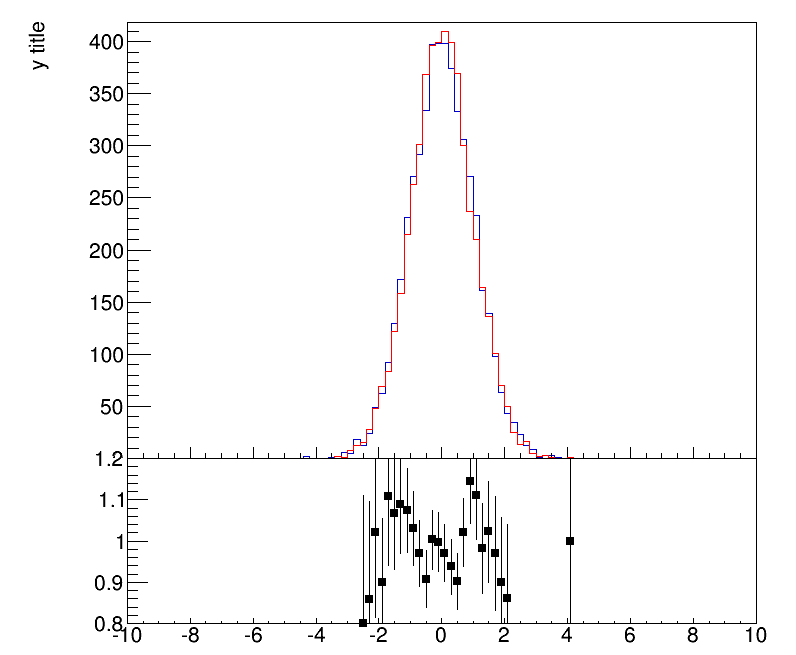
I am drawing a ratio plot but with no success I can find an easy (automatic) way to rescale sizes and offset of X and Y axis labes and titles of the second pad (the one containing the ratio plot). See below the macro you can use to reproduce the issues, which are
- if I do what I expect to have to do (given the TAttAxis documentation), x and y axes are drawn outside of the canvas
- overlap between the two Y axes
Does anybody have any suggestion?
[code]{
//
// define style
//
const Double_t titleoffset = 1.4;
const Double_t textfont = 42;
const Double_t textsize = 0.05;
const Bool_t defineStyle = kTRUE;
if (defineStyle) {
TStyle *newStyle = new TStyle(“EXAMPLE”, “Example style”);
newStyle->SetFrameBorderMode(kWhite);
newStyle->SetFrameFillColor(kWhite);
newStyle->SetCanvasBorderMode(kWhite);
newStyle->SetCanvasColor(kWhite);
newStyle->SetPadBorderMode(kWhite);
newStyle->SetPadColor(kWhite);
newStyle->SetStatColor(kWhite);
newStyle->SetPadTopMargin(0.05);
newStyle->SetPadRightMargin(0.05);
newStyle->SetPadBottomMargin(0.16);
newStyle->SetPadLeftMargin(0.16);
newStyle->SetTitleXOffset(titleoffset);
newStyle->SetTitleYOffset(titleoffset);
newStyle->SetTextFont(textfont);
newStyle->SetTextSize(textsize);

TString axes[2] = {"x", "y"};
for (UInt_t i = 0; i < 2; i++) {
  newStyle->SetLabelFont(textfont, axes[i]);
  newStyle->SetTitleFont(textfont, axes[i]);
  newStyle->SetLabelSize(textsize, axes[i]);
  newStyle->SetTitleSize(textsize, axes[i]);
}

newStyle->SetOptTitle(0);
newStyle->SetOptStat(0);
newStyle->SetOptFit(0);

gROOT->SetStyle("EXAMPLE");
gROOT->ForceStyle();
} else {
gROOT->SetStyle(“Plain”);
}
//
// plot
//
TH1F *h1 = new TH1F(“h1”, “h1;x title; y title”, 100, -10, 10);
TH1F *h2 = new TH1F(“h2”, “h2;x title; y title”, 100, -10, 10);
h1->FillRandom(“gaus”);
h2->FillRandom(“gaus”);
h1->SetLineColor(kBlue+1);
h2->SetLineColor(kRed);
TCanvas *c1 = new TCanvas(“c1”, “canvas”, 800, 800);
c1->SetFillColor(0);
c1->SetFrameFillStyle(0);
c1->cd();
const Double_t fair_share = 0.7; // Y extension of upper pad
TPad *pad1 = new TPad(“pad1”, “pad1”, 0, 1-fair_share, 1, 1.0);
pad1->SetBottomMargin(0);
pad1->Draw();
pad1->cd();
h1->Draw();
h2->Draw(“same”);
TH1F h3 = (TH1F)h1->Clone(“h3”);
h3->SetLineColor(kBlack);
c1->cd();
TPad *pad2 = new TPad(“pad2”, “pad2”, 0, 0, 1, 1-fair_share);
pad2->SetTopMargin(0);
pad2->Draw();
pad2->cd();
h3->SetMinimum(0.8);
h3->SetMaximum(1.2);
h3->Sumw2();
h3->SetStats(0);
h3->Divide(h2);
h3->SetMarkerStyle(21);
h3->Draw(“ep”);
h3->GetYaxis()->SetTitle(“ratio”);
h3->GetYaxis()->SetNdivisions(505);
// TAttAxis::SetLabelSize says: The size is expressed in per cent of the pad width
// same do TAttAxis::SetTitleSize, TAttAxis::SetLabelOffset and TAttAxis::SetTitleOffset…
h3->GetXaxis()->SetLabelSize(textsize * fair_share / (1 - fair_share));
h3->GetXaxis()->SetTitleSize(textsize * fair_share / (1 - fair_share));
h3->GetXaxis()->SetLabelSize(textsize * fair_share / (1 - fair_share));
h3->GetYaxis()->SetLabelSize(textsize * fair_share / (1 - fair_share));
h3->GetYaxis()->SetTitleSize(textsize * fair_share / (1 - fair_share));
h3->GetYaxis()->SetTitleOffset(titleoffset * fair_share / (1 - fair_share));
}[/code]