TGraph2D drawing differs significantly from TH3 drawing. In the TGraph2D, from what I understand, TPolyMarkers3D are used to draw points and they are not real 3D objects. The result is that they always appear in the order of drawing. Therefore it is often quite difficult to asses 3D properties of such a graph - rotation does not show the other side of the graph. The object that is geometrically closer to the viewer is not necessarily the one visible. This is not the case with TH3, where boxes/spheres are real 3d objects and rotating shows a proper side of the histogram, the one closest to the viewer.
As TPolyMarker3D is a dot, could it not be replaced with a sphere used to draw TH3? Or perhaps a different class, that would make a real 3D marker just like the TH3 sphere or box, as I understand that the idea between TPolyMarker3D is to have standard marker styles placed in semi-3D.
I tried to look into how TH3 draws spheres and boxes myself, but it is done using Rgl, which is rather undocumented. But perhaps to experience ROOT developer, making such a new “marker”, which is just a possibility to draw real 3d box or sphere in TH3 environment, would be a short episode of coding? And this could make TGraph2D like plots much more usable…
ROOT Version: 6.18 Platform: Not Provided Compiler: Not Provided
If you draw the TGraph2D with single dots it is not a problem. But for bigger markers it can be. I would suggest you try to use the option P0 to draw your TGraph2D. Let me know if it helps. If not, post a small macro reproducing you problem and I will have a look.
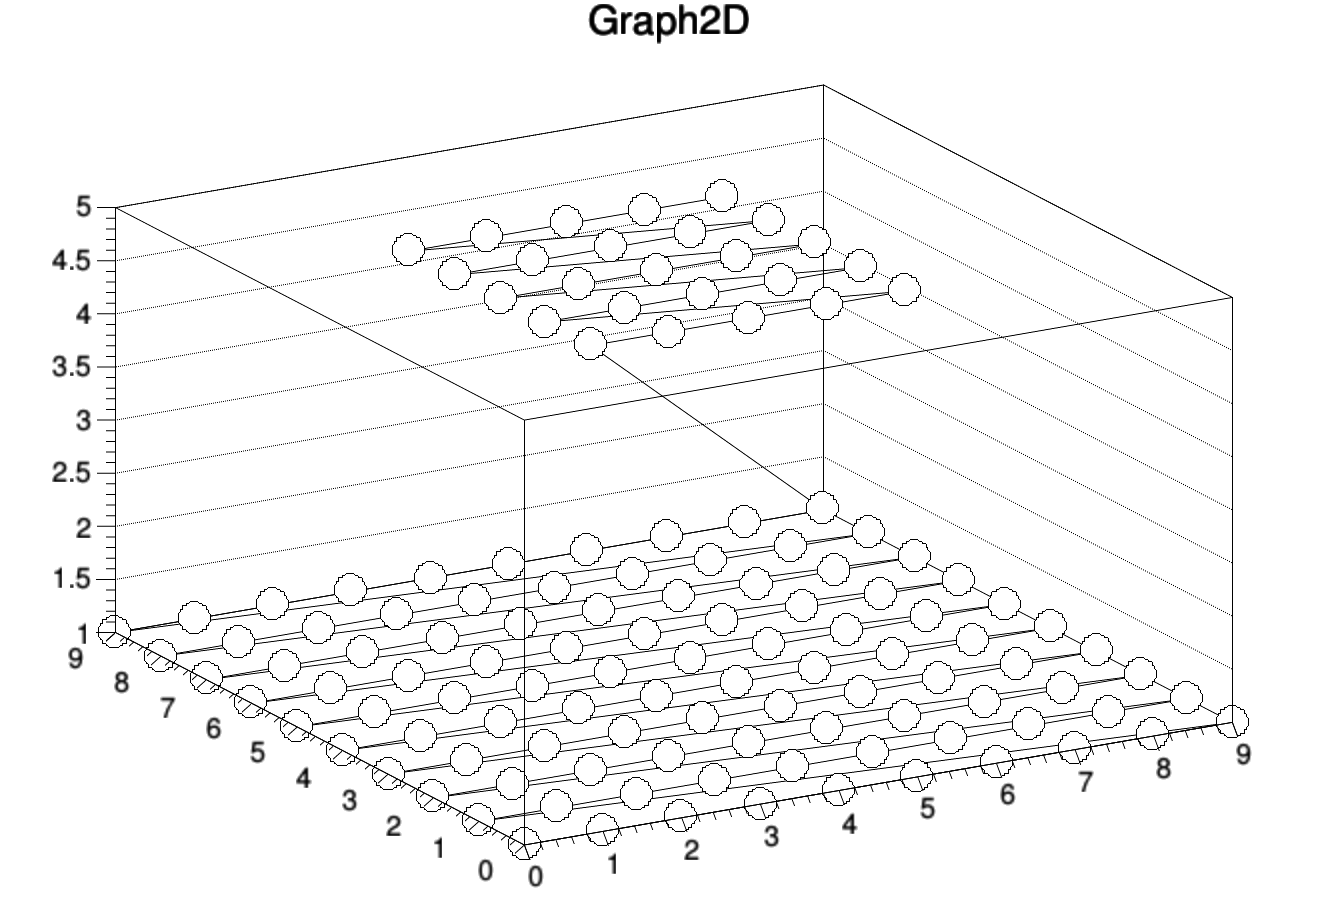
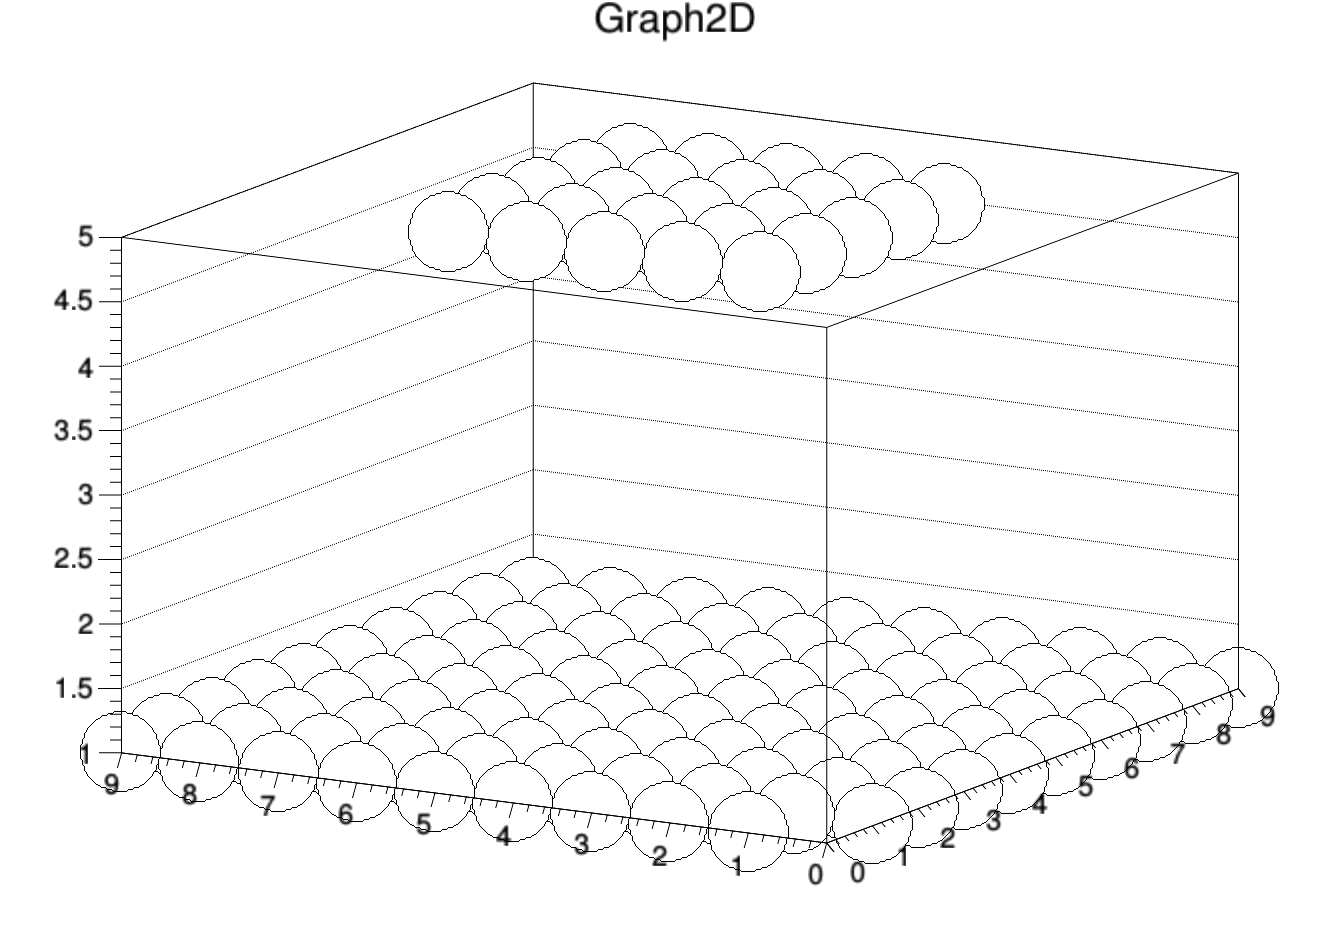
Unfortunately, p0 or p with bigger marker does not help, as the last markers seem to be always drawn on top. I attach a macro where TGraph2D has two layers of points, one at z=1, one at z=5, which drawn with “pcol” have different colours. Rotating this graph shows that the markers put into the graph last are always drawn last (and thus “on top” or “closer to the viewer”), even when they should appear obstructed by the other layer.
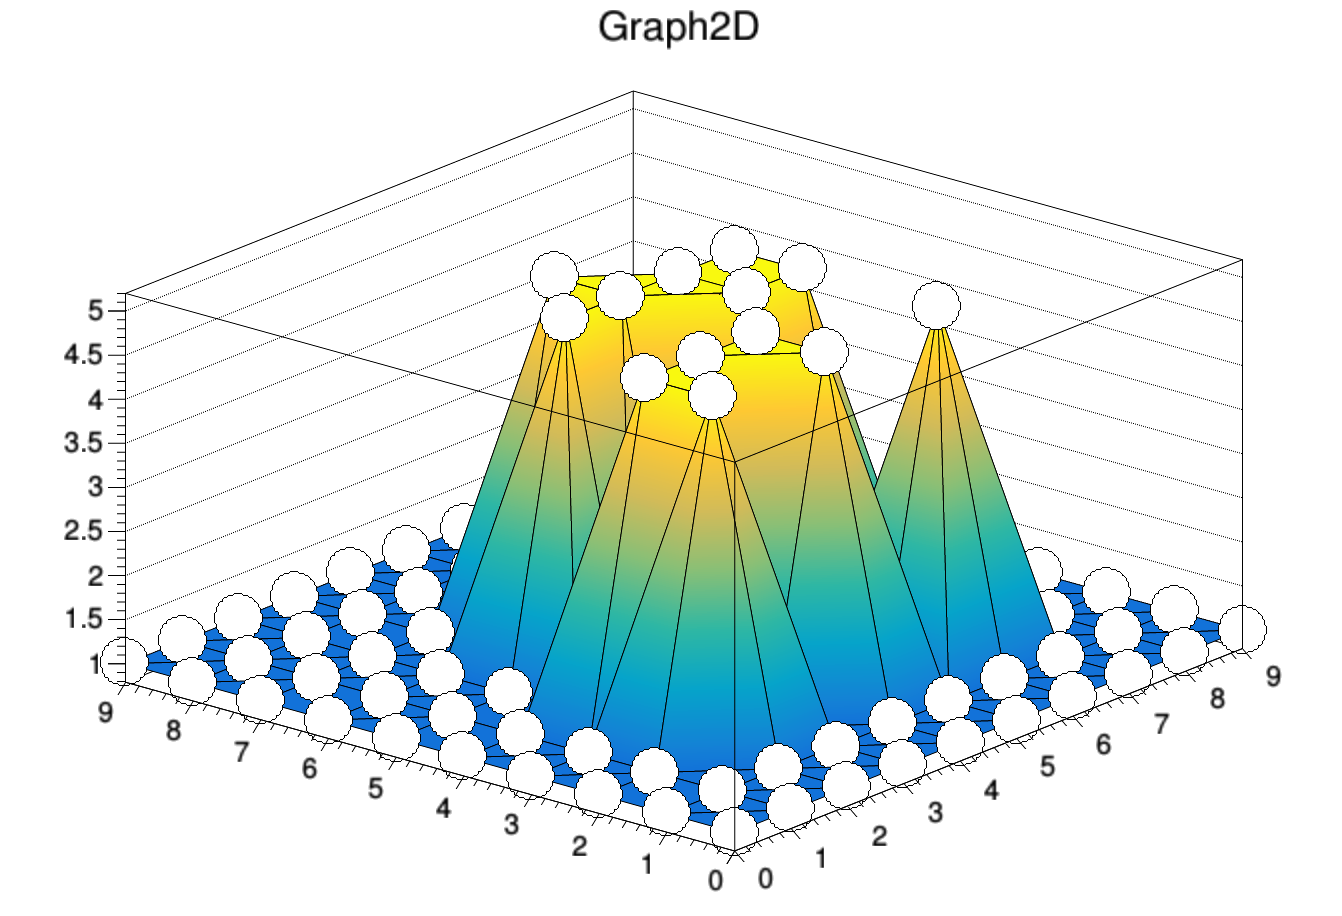
I think it is done the way in order to keep it fast (no extra computation to order the points), because when drawn with an other option requiring order (like TRI1) the points are ordered:
That’s why I was thinking that copying the same drawing method that is used fot TH3 and where it works well could be used (unless someone wants the 2D marker shapes).