Fitting graph and specifying label options

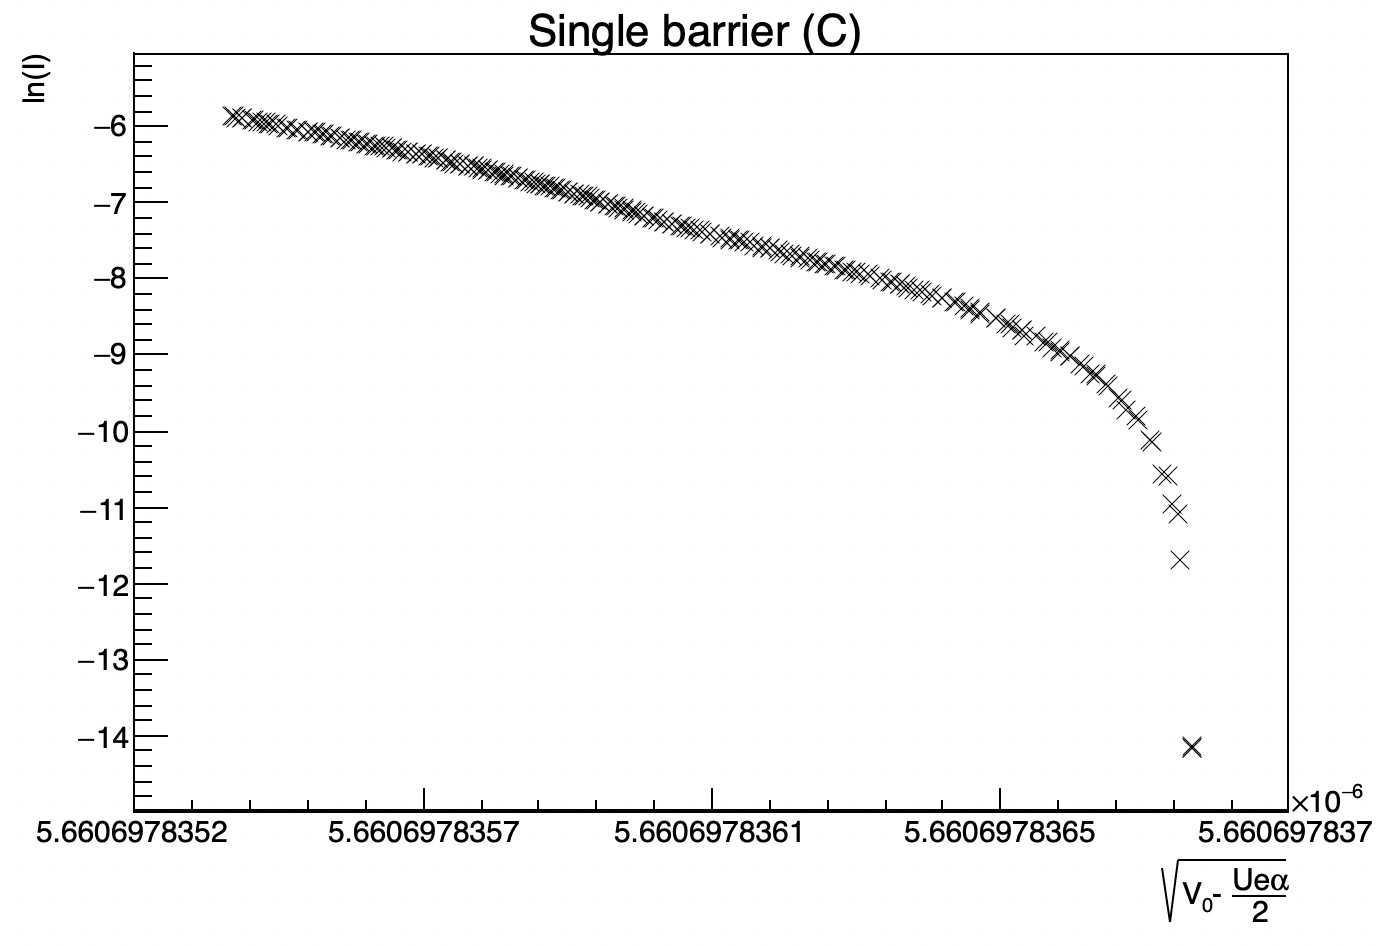
Consider the attached file. When trying to fit the graph with a polynomial of degree 1 (with the range specified in the graph), the fit turns out to be quite erroneous. What could be the reason for that? The code is very similar to the code in the first example of the TGraphPainterClass. Besides, how would one fix the x-labels so that the decimals are only specified to two or three?

Thanks!

Try a two-steps approach:

TF1 *f = ((TF1*)(gROOT->GetFunction("pol1")));
graph->Fit(f, "WQN", "", xmin, xmax); // "initial pre-fit"
graph->Fit(f, "", "", xmin, xmax); // "final fit"
1 Like

Where would one insert this? In the terminal? The value of p1 when applying the fit yields the desired slope, but it is very large and it would be nice to get the fit fitted onto the points.

Is there a solution to reduce the number of decimals displayed in the x-labels? SetDecimals only adds/removes one decimal in the FitPanel. Thanks!

Seems to me you are specifying a negative number of divisions along the X axis.

1 Like

To me it seems that the “x range” is very small, from xleft = 5.6606978352e-6 to xright = 5.660697837e-6

1 Like

Yes but the ticks look not optimized…

Try with xmin = 5.6606978352e-6 and xmax = 5.6606978365e-6

Changing the divisions in the Editor to match the xmin and xmax values won’t change anything. Do the divisions need to be fixed in the macro beforehand?

Axis labels vary at the 9th decimal. that’s why they cannot be optimized.
the difference between x min and x max is 1.8000001e-09
05

gr->Sort(); // make sure points are in the "increasing order in x"
Int_t ifirst = 0, ilast = 200;
Double_t p1 = (gr->GetY()[ilast] - gr->GetY()[ifirst]) / (gr->GetX()[ilast] - gr->GetX()[ifirst]);
Double_t p0 = gr->GetY()[ifirst] - p1 * gr->GetX()[ifirst];
// std::cout << p0 << " " << p1 << std::endl;
TF1 *f = ((TF1*)(gROOT->GetFunction("pol1")));
f->SetParameters(p0, p1); // set "reasonable" initial values
gr->Fit(f, "F", "", gr->GetX()[ifirst], gr->GetX()[ilast]);
1 Like