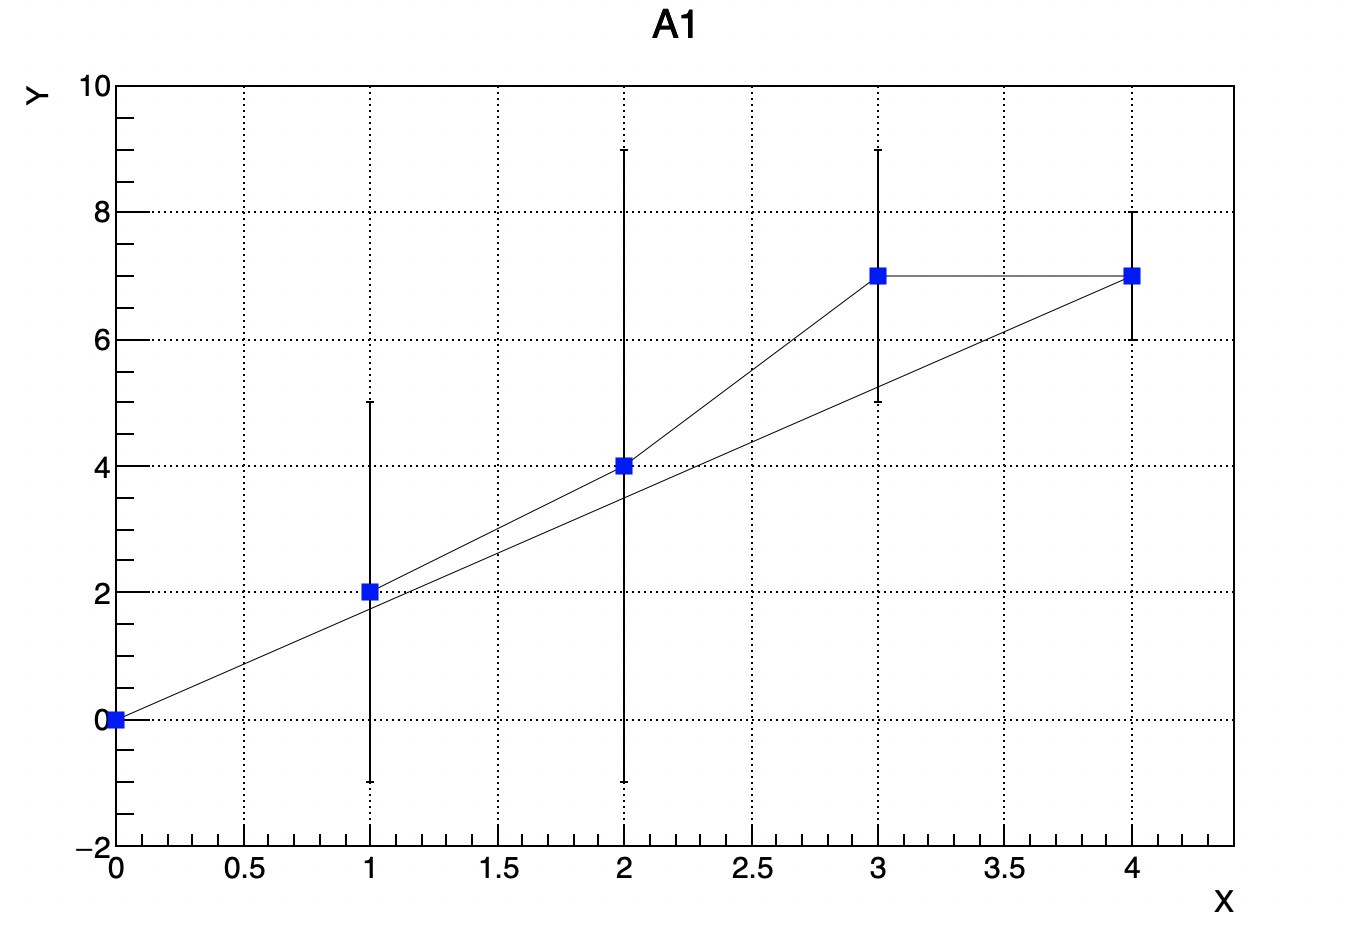
I am trying to plot a linear fit through five points that have error bars. But it does not appear. Here is my code:
# include <iostream>
# include <fstream>
# include <math.h>
# include <iomanip>
# include <cmath>
# include <stdlib.h>
# include <cstdlib>
//# include <fstream.h>
# include <string.h>
# include <string>
//# include <dos.h> //For Sleep()

# include "TROOT.h"
# include "TFile.h"
# include "TTree.h"
# include "TBrowser.h"
# include "TH1.h"
# include "TH2.h"
# include "TH3.h"
# include "TRandom.h"

int main(){

	// controls
	char inputFileName[50] = "A1_line.dat";
	Int_t NumOfLines = 4;
	Int_t nArray = NumOfLines + 1;
	bool WantToFit = true;

	char FitFunc[20] = "[0]*x + [1]";
	int xmin = 0;
	int xmax = 5;

   // create the coordinate arrays
   Double_t x[nArray];
   Double_t y[nArray];

    // create the error arrays
   Double_t dx[5] = {0};
   Double_t dy[nArray];

	ifstream inFile;
	inFile.open(inputFileName,ios::in);

	if(inFile.is_open()){
		cout<<"Input File was opened successfully"<<endl;
	}

	//Main loop filling arrays from file//
	inFile>>x[0]>>y[0]>>dy[0];
	cout<<x[0]<<setw(20)<<y[0]<<setw(20)<<dy[0]<<endl;

	for(int i = 1; i < NumOfLines; i++){

		inFile>>x[i]>>y[i]>>dy[i];
		cout<<x[i]<<setw(20)<<y[i]<<setw(20)<<dy[i]<<endl;

	}

	inFile.close();


	// create the canvas
   TCanvas *c1 = new TCanvas("c1","A1",200,10,700,500);
   c1->SetGrid();

   // create the TGraphErrors and draw it
   TGraphErrors *gr = new TGraphErrors(nArray,x,y,dx,dy);
   gr->SetTitle("A1;X;Y");
   gr->SetMarkerColor(4);
   gr->SetMarkerStyle(21);
   gr->Draw("AP");

      	// Define Fit Function
	if (WantToFit){
		TF1 *f = new TF1("f", FitFunc, xmin, xmax);
		f->SetParNames("slope","offset");
		f->SetParameters(0.5,1);

		gr->Fit(f);
	}


   c1->Update();

	return 0;
}