Fit w/ Gaussian and Linear Background

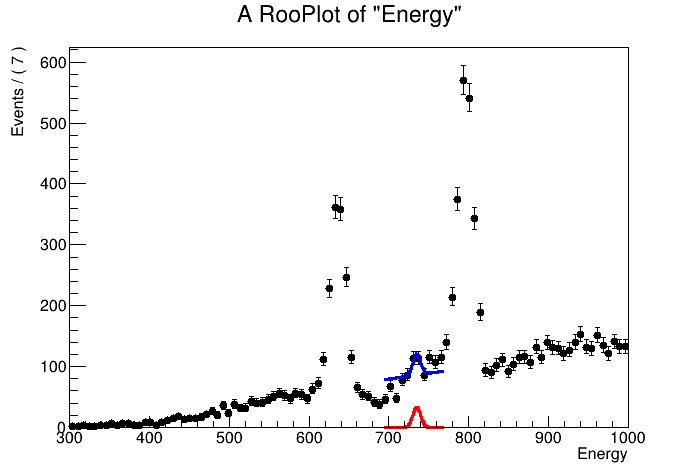
I’d like to do an unbinned fit with a pdf that’s a basic gaussian with fixed parameters and an adjustable linear background. I have an attached data set that should be a small/nonexistent gaussian yield and a basic small slope. I’m a RooFit beginner, so I understand that part of the problem with this is that the a simple m*x+b formula doesn’t normalize to 1, and that the formula will by definition be negative at some point. The linear background should never be negative over the provided range, but I don’t understand how to encode that inequality into a RooFormulaVar.

using namespace RooFit;

void linfit(){
  TFile *f = new TFile("Linefit.root");
  TTree *t = (TTree*)f->Get("G2 m4 T");

  RooRealVar En("Energy","Energy",690,790);

  RooRealVar mean("mean","mean",735);
  RooRealVar fwhm("fwhm","fwhm",5);
  RooGaussian gss("gss","gss",En,mean,fwhm);

  RooRealVar c1("c1","c1",1,-1000,1000);
  RooRealVar c2("c2","c2",1,-1000,1000);
  RooGenericPdf linear("linear","c1+c2*(Energy)",RooArgList(c1,c2,En));

  RooRealVar sigy("sigy","sigy",1,0,10000);
  RooRealVar bkgy("bkgy","bkgy",1,0,10000);

  RooAddPdf model("model","model",RooArgList(gss,linear),RooArgList(sigy,bkgy));

  RooDataSet data("data","data",RooArgSet(En),Import(*t));

  model.fitTo(data,Range(690,790),Extended());

  RooPlot *P = En.frame();
  data.plotOn(P);
  model.plotOn(P);
  model.plotOn(P,Components(gss),LineColor(kRed));
  P->Draw();
}

Any assistance is appreciated!

ForumPost.C (852 Bytes)
Linefit.root (318.3 KB)

@StephanH, please can you help here?

Oksana

Hi @usccaa,

what is happening if you run the fit? Error messages? It does not converge?
Uploading a picture of the distribution would also be helpful because people could look at it without having to download and run the example.

Now, that I downloaded and ran the example, there are a couple of things to say:

  • You can get it to work by ensuring that the slope is positive.
  • Fiddling around with the fit range is also helpful. If you make it a bit smaller, it works better.
  • However, the real reason why the fit doesn’t work is that the model is just wrong to describe the data. Please look at the attached picture. I kept fit model, range and parameters almost the same (but I implemented the two suggestions above), and then I extended the range of En. A model that will fit the data is a (more or less) linear background fitted over the full range of about 300 to 1000, and four peak models (Gaussian, Breit-Wigner etc.) for the resonances at 630, 700, 740, 800. The linear background just doesn’t work because it has to fit the two neighbouring resonances that you see on the plot. I therefore suggest to change your fit model.

To get you started, see the attached macro. I quickly added a couple of resonances. I didn’t manage to catch the one at 700, but you will see how to do it.

ForumPost.C (1.8 KB)

Thank you for the quick and thorough responses.

I’ll remember to include images/etc. the next time I post here.

I realize that the function I’m using is basic, that’s mostly because I’m trying to understand RooFit itself and I only care about a couple of narrow regions in a few plots like this one. Restricting the slope to be positive works, but I worry there will be other regions where a negative slope will be required. Is there a way to keep the function more general/basic, but prevent RooFit from considering parameters that would make the function negative over those ranges?

RooFit kind of does this automatically. When the PDF turns negative, RooFit returns a very large number to the minimiser. That will drive the minimiser away from the parameter values that cause a PDF to be negative.

This topic was automatically closed 14 days after the last reply. New replies are no longer allowed.