Hello,
I’m using my own hand-made pdf class inherited from RooAbsPdf, as shown in the User’s Manual. Basically I am having in “Double_t evaluate() const ;” a self-defined convolution of 2 Crystall Balls times a correlation factor (basically around 1). See a bit of code below:
Header:
...
class RooIntegralMultiplication : public RooAbsPdf {
public:
  RooIntegralMultiplication() {} ;
  RooIntegralMultiplication(const char *name, const char *title,
        RooAbsReal& _xStar,
        RooAbsReal& _mean,
        RooAbsReal& _sigma,
        RooAbsReal& _alpha,
        RooAbsReal& _n,
        RooAbsReal& _mean2,
        RooAbsReal& _sigma2,
        RooAbsReal& _alpha2,
        RooAbsReal& _n2);
...
Implementation:
...
RooIntegralMultiplication::RooIntegralMultiplication(const char *name, const char *title,
RooAbsReal& _xStar,
RooAbsReal& _mean,
RooAbsReal& _sigma,
RooAbsReal& _alpha,
RooAbsReal& _n,
RooAbsReal& _mean2,
RooAbsReal& _sigma2,
RooAbsReal& _alpha2,
RooAbsReal& _n2):
RooAbsPdf(name,title),
xStar_("xStar","xStar",this,_xStar),
mean_("mean","mean", this,_mean ),
sigma_("sigma","sigma",this,_sigma ),
alpha_("alpha","alpha",this,_alpha ),
n_("n","n",this, _n),
mean2_("mean2","mean2", this,_mean2 ),
sigma2_("sigma2","sigma2",this,_sigma2 ),
alpha2_("alpha2","alpha2",this,_alpha2 ),
n2_("n2","n2",this, _n2)
{
}
...
// Numerical "Quick and Dirty" Integral
Double_t RooIntegralMultiplication::evaluate() const
{
double xlow = xStar_ - width;
double xupp = xStar_ + width;
double step = (xupp-xlow) / subintervals;
double xx;
double sum = 0.0;
// Numerical Integration
for(int i=1.0; i<=subintervals/2; i++) {
xx = xlow + (i-.5) * step;
// return a factor around 1
double expectCorrFac = GetWeightFactor((xStar_ / xx), xx );
sum += returnCBSFuncVal( (xStar_ / xx) , mean2_, sigma2_, alpha2_, n2_)
* returnCBSFuncVal( xx , mean_, sigma_, alpha_, n_) * (1/xx) * expectCorrFac;
//
xx = xupp - (i-.5) * step;
sum += returnCBSFuncVal( (xStar_ / xx), mean2_, sigma2_, alpha2_, n2_)
* returnCBSFuncVal( xx, mean_, sigma_, alpha_, n_) * (1/xx) * expectCorrFac;
}
return (step * sum);
}
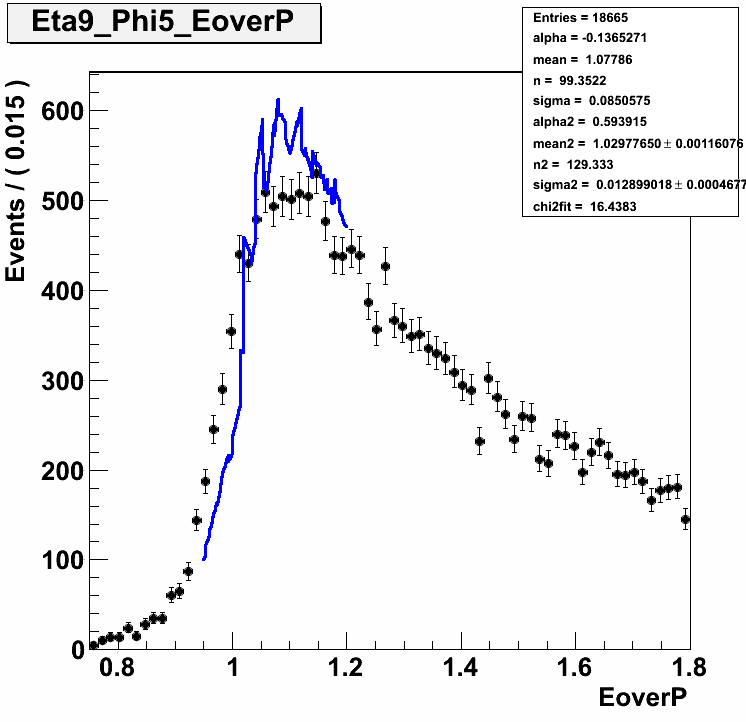
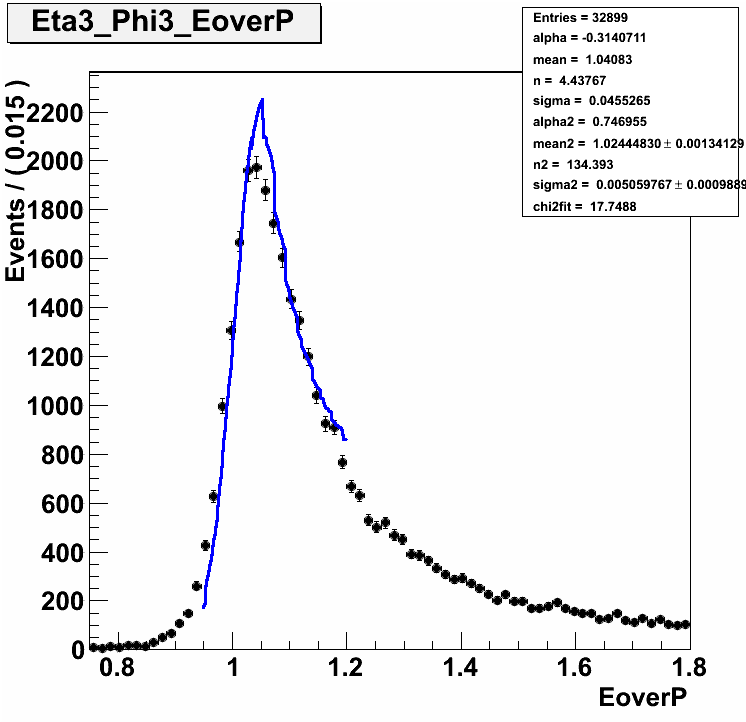
....After fitting that self created PDF to a binned DataSet, the results look really promising ( fitted values are in the expected ranges ) but the plots look not good at all ( see in the attachment the blue fitted curve over the dotted dataset is totally wiggly ). I don’t understand why i have these wiggles in the final plot. After several tests I guess that these wiggles are much stronger in fits where the error bars of the input dataset a large. The behaviour of the wiggles does not change (or just slightly) with the number of bins.
My questions now:
How does RooFit actually draw the blue curve of the fit ?
I guess it does not simply connect the fitted values per bin with a curved line ?
Am I correct that Roofit integrates after the fitting procedure the whole PDF and draws it as it comes out of the Integral ?
If yes: Is there a way to tell RooFit to smooth-en the Integral or adjust the number of integration steps or so ?
Thanks very much!
best regards,
Florian