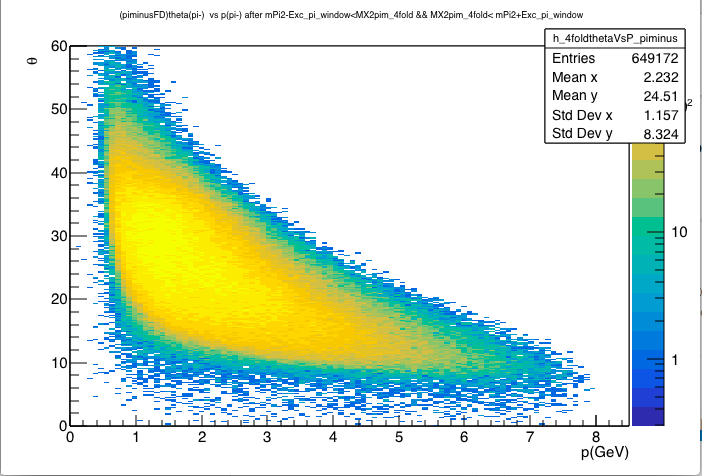
This is a newbie question. I need draw a fit line(function) for the following attached plot (upper side of the plot).
I am not sure how to draw a fit function by joining points.
Piecewise straight lines joining the points
(p, theta)
0.5, 45.
1.5, 45.
3.0, 35.
4.0, 26.
5.0, 20.
7.0, 15.